CarMax 2002 Annual Report Download - page 73
Download and view the complete annual report
Please find page 73 of the 2002 CarMax annual report below. You can navigate through the pages in the report by either clicking on the pages listed below, or by using the keyword search tool below to find specific information within the annual report.-
 1
1 -
2
-
3
-
4
-
5
-
6
-
7
-
8
-
9
-
10
-
11
-
12
-
13
-
14
-
15
-
16
-
17
-
18
-
19
-
20
-
21
-
22
-
23
-
24
-
25
-
26
-
27
-
28
-
29
-
30
-
31
-
32
-
33
-
34
-
35
-
36
-
37
-
38
-
39
-
40
-
41
-
42
-
43
-
44
-
45
-
46
-
47
-
48
-
49
-
50
-
51
-
52
-
53
-
54
-
55
-
56
-
57
-
58
-
59
-
60
-
61
-
62
-
 63
63 -
 64
64 -
 65
65 -
 66
66 -
 67
67 -
 68
68 -
 69
69 -
 70
70 -
 71
71 -
 72
72 -
 73
73 -
 74
74 -
 75
75 -
 76
76 -
 77
77 -
 78
78 -
 79
79 -
 80
80 -
 81
81 -
 82
82 -
 83
83 -
84
-
85
-
86
-
87
-
88
-
89
-
90
-
91
-
92
-
93
-
94
-
95
-
96
-
97
-
98
-
99
-
100
-
101
-
102
-
103
-
104
 |
 |

71 CIRCUIT CITY STORES, INC. ANNUAL REPORT 2002
CIRCUIT CITY GROUP
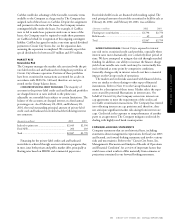
(F) 401(K) PLAN: Effective August 1, 1999, the Company
began sponsoring a 401(k) Plan for all employees meeting cer-
tain eligibility criteria. Under the Plan, eligible employees can
contribute up to 15 percent of their salaries, and the Company
matches a portion of those employee contributions. The
Company’s expense for this plan for Circuit City associates was
$3,464,000 in fiscal 2002, $3,996,000 in fiscal 2001 and
$2,158,000 in fiscal 2000.
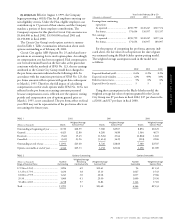
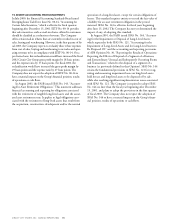
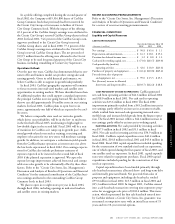
The Circuit City Group’s stock option activity is summa-
rized in Table 1. Table 2 summarizes information about stock
options outstanding as of February 28, 2002.
Circuit City applies APB Opinion No. 25 and related inter-
pretations in accounting for its stock option plans. Accordingly,
no compensation cost has been recognized. Had compensation
cost been determined based on the fair value at the grant date
consistent with the methods of SFAS No. 123, the net earnings
attributed to the Circuit City Group would have changed to
the pro forma amounts indicated in the following table. In
accordance with the transition provisions of SFAS No. 123, the
pro forma amounts reflect options with grant dates subsequent
to March 1, 1995. Therefore, the full impact of calculating
compensation cost for stock options under SFAS No. 123 is not
reflected in the pro forma net earnings amounts presented
because compensation cost is reflected over the options’ vesting
periods and compensation cost of options granted prior to
March 1, 1995, is not considered. The pro forma effect on fiscal
year 2002 may not be representative of the pro forma effects on
net earnings for future years.
Years Ended February 28 or 29
(Amounts in thousands) 2002 2001 2000
Earnings from continuing
operations:
As reported............................... $190,799 $149,247 $327,574
Pro forma................................. 174,654 136,957 319,337
Net earnings:
As reported............................... $190,799 $149,247 $197,334
Pro forma................................. 174,654 136,957 189,097
For the purpose of computing the pro forma amounts indi-
cated above, the fair value of each option on the date of grant
was estimated using the Black-Scholes option-pricing model.
The weighted average assumptions used in the model were
as follows:
2002 2001 2000
Expected dividend yield.......................... 0.6% 0.2% 0.2%
Expected stock volatility ......................... 62% 49% 38%
Risk-free interest rates............................. 5% 6% 6%
Expected lives (in years).......................... 5 5 5
Using these assumptions in the Black-Scholes model, the
weighted average fair value of options granted for the Circuit
City Group was $7 per share in fiscal 2002, $17 per share in fis-
cal 2001 and $17 per share in fiscal 2000.
TABLE 1 2002 2001 2000
Weighted Average Weighted Average Weighted Average
(Shares in thousands) Shares Exercise Price Shares Exercise Price Shares Exercise Price
Outstanding at beginning of year............. 8,720 $28.59 7,380 $25.07 8,894 $18.25
Granted .................................................... 4,423 12.80 4,280 34.80 1,564 40.75
Exercised................................................... (541) 15.45 (1,526) 23.64 (2,864) 12.65
Cancelled.................................................. (611) 23.96 (1,414) 34.25 (214) 22.06
Outstanding at end of year....................... 11,991 $23.60 8,720 $28.60 7,380 $25.07
Options exercisable at end of year ............ 4,346 $25.33 3,158 $21.86 1,258 $13.89
TABLE 2 Options Outstanding Options Exercisable
Weighted Average
(Shares in thousands) Number Remaining Weighted Average Number Weighted Average
Range of Exercise Prices Outstanding Contractual Life Exercise Price Exercisable Exercise Price
$ 9.94 to 12.45........................................ 3,896 6.9 $12.41 96 $11.32
13.25 to 17.93........................................ 1,634 3.8 15.13 1,067 15.43
18.00 to 27.95........................................ 1,243 3.0 20.18 1,037 19.86
29.50 ...................................................... 1,000 0.1 29.50 1,000 29.50
30.48 to 43.03........................................ 4,218 5.7 36.82 1,146 37.03
Total ......................................................... 11,991 5.1 $23.60 4,346 $25.33