CarMax 2002 Annual Report Download - page 82
Download and view the complete annual report
Please find page 82 of the 2002 CarMax annual report below. You can navigate through the pages in the report by either clicking on the pages listed below, or by using the keyword search tool below to find specific information within the annual report.-
 1
1 -
2
-
3
-
4
-
5
-
6
-
7
-
8
-
9
-
10
-
11
-
12
-
13
-
14
-
15
-
16
-
17
-
18
-
19
-
20
-
21
-
22
-
23
-
24
-
25
-
26
-
27
-
28
-
29
-
30
-
31
-
32
-
33
-
34
-
35
-
36
-
37
-
38
-
39
-
40
-
41
-
42
-
43
-
44
-
45
-
46
-
47
-
48
-
49
-
50
-
51
-
52
-
53
-
54
-
55
-
56
-
57
-
58
-
59
-
60
-
61
-
62
-
63
-
64
-
65
-
66
-
67
-
68
-
69
-
70
-
71
-
 72
72 -
 73
73 -
 74
74 -
 75
75 -
 76
76 -
 77
77 -
 78
78 -
 79
79 -
 80
80 -
 81
81 -
 82
82 -
 83
83 -
 84
84 -
 85
85 -
 86
86 -
 87
87 -
 88
88 -
 89
89 -
 90
90 -
 91
91 -
 92
92 -
93
-
94
-
95
-
96
-
97
-
98
-
99
-
100
-
101
-
102
-
103
-
104
 |
 |

CIRCUIT CITY STORES, INC. ANNUAL REPORT 2002 80
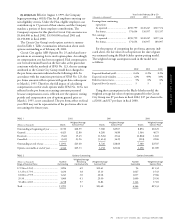
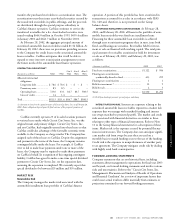
NEW-CAR FRANCHISES
New-Car Franchises
at Year-End
Fiscal 2002 2001 2000
Integrated/co-located new-car franchises............... 15 17 15
Stand-alone new-car franchises.............................. 3 5 5
Total...................................................................... 18 22 20
CarMax sells extended warranties on behalf of unrelated third
parties who are the primary obligors. Under these third-party
warranty programs, we have no contractual liability to the cus-
tomer. Extended warranty revenue, which is reported in total
sales, was 1.7 percent of total sales in fiscal 2002, 1.8 percent in
fiscal 2001 and 1.6 percent in fiscal 2000. Used cars achieve a
higher warranty penetration rate than new cars.
IMPACT OF INFLATION. Inflation has not been a significant con-
tributor to results. For the CarMax business, profitability is
based on achieving specific gross profit dollars per vehicle rather
than on average retail prices. Because the wholesale market gen-
erally adjusts to reflect retail price trends, we believe that if the
stores meet inventory turn objectives, then changes in average
retail prices will have only a short-term impact on the gross
margin and thus profitability.
Cost of Sales
The gross profit margin was 12.6 percent in fiscal 2002, 13.2
percent in fiscal 2001 and 11.9 percent in fiscal 2000. Although
we achieved our specific gross profit dollar targets per vehicle,
increased average retail prices resulting from a higher mix of
later-model used cars, luxury vehicles and sport utility vehicles
generated the decline in gross profit as a percentage of sales in
fiscal 2002. Used-car gross profit dollars are similar across
makes and models. Consequently, the gross profit on a higher-
priced used car is a lower percentage of the retail selling price
than on a more modestly priced car. In fiscal 2001, the increase
in used-car sales as a percentage of our total sales mix and
strong inventory management throughout the year, especially
during the second half when the model-year transition occurs
in the new-car industry, contributed to a higher gross margin.
Selling, General and Administrative Expenses
Selling, general and administrative expenses were 7.9 percent
of sales in fiscal 2002, 9.8 percent in fiscal 2001 and 11.3
percent in fiscal 2000. Profits generated by the CarMax
finance operation, fees received for arranging customer auto-
mobile financing through third parties and interest income
are recorded as reductions to selling, general and administra-
tive expenses.
The improvement in the fiscal 2002 expense ratio reflects
significant expense leverage generated by strong comparable
store sales growth and continued expense management, particu-
larly of non-store expenses, the benefit of which more than offset
higher second half expenses related to renewed geographic
expansion. In addition, a lower cost of funds increased yield
spreads and contributed to higher profits from the finance oper-
ation in fiscal 2002. The decline in the fiscal 2001 expense ratio
reflects leverage from strong comparable store sales growth,
more efficient advertising expenditures and overall improve-
ments in store productivity, including those achieved through
the hub-and-satellite operating strategy that we adopted in
multi-store markets. Advertising expense was 1.5 percent of
sales in fiscal 2002, 1.8 percent in fiscal 2001 and 2.4 percent
in fiscal 2000.
In fiscal 2001, the improvement in the expense ratio was
partly offset by an $8.7 million write-off of goodwill associated
with two underperforming stand-alone new-car franchises.
Excluding these costs, the fiscal 2001 expense ratio would have
been 9.4 percent. The fiscal 2000 expense ratio reflects $4.8
million in charges related to lease termination costs on undevel-
oped property and a write-down of assets associated with excess
property for sale. Excluding these costs, the fiscal 2000 expense
ratio would have been 11.1 percent.
Interest Expense
Interest expense was 0.2 percent of sales in fiscal 2002 and 0.5
percent in both fiscal 2001 and fiscal 2000. In fiscal 2002,
interest expense primarily was incurred on allocated debt used
to fund new store growth and working capital, including inven-
tory. In fiscal 2001 and 2000, interest expense primarily was
incurred on allocated debt used to fund working capital,
including inventory, and franchise acquisitions. The fiscal 2002
decline in the interest expense ratio reflects a reduction in allo-
cated debt levels and lower interest rates. The reduction in allo-
cated debt reflects a decline in total debt of the Company
during fiscal 2002. Refer to the “Financing Activities” section
below for further information on changes in debt.
Earnings Before Income Taxes
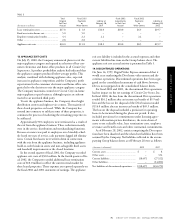
Earnings before income taxes were $146.5 million in fiscal
2002, compared with $73.5 million in fiscal 2001 and $1.8
million in fiscal 2000. Excluding the write-off of goodwill,
earnings before income taxes would have been $82.2 million in
fiscal 2001. Excluding lease termination costs and the write-
down of assets, earnings before income taxes would have been
$6.6 million in fiscal 2000.
Income Taxes
The effective income tax rate was 38.0 percent in fiscal 2002,
fiscal 2001 and fiscal 2000.
Net Earnings
Net earnings were $90.8 million in fiscal 2002, $45.6 million
in fiscal 2001 and $1.1 million in fiscal 2000. Excluding the
write-off of goodwill, net earnings would have been $51.0 mil-
lion in fiscal 2001. Excluding lease termination costs and the
write-down of assets, net earnings would have been $4.1 mil-
lion in fiscal 2000. Net earnings attributed to the outstanding
CarMax Group Common Stock were $28.0 million in fiscal
2002, $11.6 million in fiscal 2001 and $256,000 in fiscal 2000.