CarMax 2002 Annual Report Download - page 30
Download and view the complete annual report
Please find page 30 of the 2002 CarMax annual report below. You can navigate through the pages in the report by either clicking on the pages listed below, or by using the keyword search tool below to find specific information within the annual report.-
 1
1 -
2
-
3
-
4
-
5
-
6
-
7
-
8
-
9
-
10
-
11
-
12
-
13
-
14
-
15
-
16
-
17
-
18
-
19
-
 20
20 -
 21
21 -
 22
22 -
 23
23 -
 24
24 -
 25
25 -
 26
26 -
 27
27 -
 28
28 -
 29
29 -
 30
30 -
 31
31 -
 32
32 -
 33
33 -
 34
34 -
 35
35 -
 36
36 -
 37
37 -
 38
38 -
 39
39 -
 40
40 -
41
-
42
-
43
-
44
-
45
-
46
-
47
-
48
-
49
-
50
-
51
-
52
-
53
-
54
-
55
-
56
-
57
-
58
-
59
-
60
-
61
-
62
-
63
-
64
-
65
-
66
-
67
-
68
-
69
-
70
-
71
-
72
-
73
-
74
-
75
-
76
-
77
-
78
-
79
-
80
-
81
-
82
-
83
-
84
-
85
-
86
-
87
-
88
-
89
-
90
-
91
-
92
-
93
-
94
-
95
-
96
-
97
-
98
-
99
-
100
-
101
-
102
-
103
-
104
 |
 |

CIRCUIT CITY STORES, INC. ANNUAL REPORT 2002 28
THE CARMAX GROUP. For the CarMax business, selling, general
and administrative expenses were 7.9 percent of sales in fiscal
2002, 9.8 percent in fiscal 2001 and 11.3 percent in fiscal 2000.
The improvement in the fiscal 2002 expense ratio reflects sig-
nificant expense leverage generated by strong comparable store
sales growth and continued expense management, particularly of
non-store expenses, the benefit of which more than offset higher
second half expenses related to renewed geographic expansion.
In addition, a lower cost of funds increased yield spreads and
contributed to higher profits from the finance operation in fiscal
2002. The decline in the fiscal 2001 expense ratio reflects lever-
age from strong comparable store sales growth, more efficient
advertising expenditures and overall improvements in store pro-
ductivity, including those achieved through the hub-and-satellite
operating strategy that we adopted in multi-store markets.
Advertising expense was 1.5 percent of sales in fiscal 2002, 1.8
percent in fiscal 2001 and 2.4 percent in fiscal 2000.
In fiscal 2001, the improvement in the expense ratio was
partly offset by an $8.7 million write-off of goodwill associated
with two underperforming stand-alone new-car franchises.
Excluding these costs, the fiscal 2001 expense ratio would have
been 9.4 percent. The fiscal 2000 expense ratio reflects $4.8
million in charges related to lease termination costs on undevel-
oped property and a write-down of assets associated with excess
property for sale. Excluding these costs, the fiscal 2000 expense
ratio would have been 11.1 percent.
Interest Expense
Interest expense was less than 0.1 percent of sales in fiscal 2002
and was 0.2 percent in both fiscal 2001 and fiscal 2000. The fis-
cal 2002 decline in the interest expense ratio reflects a decline
in total debt of the Company and lower interest rates. Refer to
the “Financing Activities” section below for further information
on changes in debt.
Income Taxes
The effective income tax rate was 38.0 percent in fiscal 2002,
fiscal 2001 and fiscal 2000.
Earnings from Continuing Operations
Earnings from continuing operations for Circuit City Stores, Inc.
were $218.8 million in fiscal 2002, compared with $160.8 mil-
lion in fiscal 2001 and $327.8 million in fiscal 2000. Increased
earnings posted by both the Circuit City and CarMax businesses
drove the fiscal 2002 improvement. The decline in fiscal 2001
reflects the lower earnings for the Circuit City business, partly
offset by the increased earnings achieved by the CarMax business.
In a public offering completed during the second quarter of
fiscal 2002, the Company sold 9,516,800 shares of CarMax
Group Common Stock that previously had been reserved for
the Circuit City Group or for issuance to holders of Circuit
City Group Common Stock. With the impact of the offering,
69.2 percent of the CarMax Group’s earnings were attributed to
the Circuit City Group’s reserved CarMax Group shares in fiscal
2002. In fiscal 2001, 74.6 percent of the CarMax Group’s earn-
ings were attributed to the Circuit City Group’s reserved
CarMax Group shares, and in fiscal 2000, 77.1 percent of the
CarMax Group’s earnings were attributed to the Circuit City
Group’s reserved CarMax Group shares.
THE CIRCUIT CITY GROUP. For the Circuit City business, earnings
from continuing operations before the income attributed to the
reserved CarMax Group shares were $128.0 million, or 62 cents
per Circuit City Group share, in fiscal 2002, compared with
$115.2 million, or 56 cents per Circuit City Group share, in fiscal
2001 and $326.7 million, or $1.60 per Circuit City Group share,
in fiscal 2000. Excluding in fiscal 2002 the remodel and relocation
expenses and lease termination costs related to the appliance exit,
and in fiscal 2001 the estimated sales disruption during the seven
to 10 days of partial remodeling, appliance exit costs, appliance
merchandise markdowns, remodel and relocation expenses and
severance costs related to the workforce reduction, earnings from
continuing operations before the income attributed to the reserved
CarMax Group shares would have been $146.2 million, or 71
cents per Circuit City Group share, in fiscal 2002 and $205.1 mil-
lion, or $1.00 per Circuit City Group share, in fiscal 2001.
The net earnings attributed to the Circuit City Group’s
reserved CarMax Group shares were $62.8 million, or 30 cents
per Circuit City Group share, in fiscal 2002, compared with
$34.0 million, or 17 cents per Circuit City Group share, in fis-
cal 2001 and $862,000 in fiscal 2000.
Earnings from continuing operations attributed to the
Circuit City Group, including income attributed to the reserved
CarMax Group shares, were $190.8 million, or 92 cents per
Circuit City Group share, in fiscal 2002; $149.2 million, or 73
cents per Circuit City Group share, in fiscal 2001; and $327.6
million, or $1.60 per Circuit City Group share, in fiscal 2000.
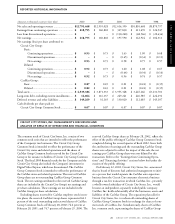
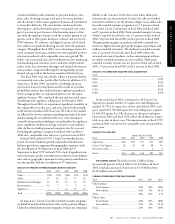
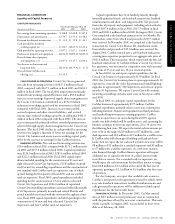
CIRCUIT CITY GROUP DILUTED EARNINGS PER SHARE
FROM CONTINUING OPERATIONS
Fiscal 2002 2001 2000
Circuit City business ..................................... $ 0.71 $ 1.00 $1.60
Impact of appliance exit costs........................ (0.03) (0.09) –
Impact of appliance merchandise
markdowns(1) ........................................... – (0.08) –
Impact of partial remodel costs(2)................... – (0.09) –
Impact of estimated sales disruption.............. – (0.03) –
Impact of remodel and relocation costs(2) ...... (0.06) (0.13) –
Impact of workforce reduction costs(2) ........... – (0.02) –
Reserved CarMax Group shares .................... 0.30 0.17 –
Circuit City Group ....................................... $ 0.92 $ 0.73 $1.60
(1) Reflected as a reduction in gross profit margins.
(2) Reflected as an increase in selling, general and administrative expenses.
THE CARMAX GROUP. For the CarMax business, net earnings
were $90.8 million in fiscal 2002, $45.6 million in fiscal 2001
and $1.1 million in fiscal 2000. Excluding the write-off of good-
will, net earnings would have been $51.0 million in fiscal 2001.
Excluding lease termination costs and the write-down of assets,
net earnings would have been $4.1 million in fiscal 2000. Net
earnings attributed to the outstanding CarMax Group Common
Stock were $28.0 million, or 82 cents per share, in fiscal 2002;
$11.6 million, or 43 cents per share, in fiscal 2001; and $256,000,
or 1 cent per share, in fiscal 2000. The net earnings attributed
to the outstanding CarMax Group Common Stock grew faster