CarMax 2002 Annual Report Download - page 48
Download and view the complete annual report
Please find page 48 of the 2002 CarMax annual report below. You can navigate through the pages in the report by either clicking on the pages listed below, or by using the keyword search tool below to find specific information within the annual report.-
 1
1 -
2
-
3
-
4
-
5
-
6
-
7
-
8
-
9
-
10
-
11
-
12
-
13
-
14
-
15
-
16
-
17
-
18
-
19
-
20
-
21
-
22
-
23
-
24
-
25
-
26
-
27
-
28
-
29
-
30
-
31
-
32
-
33
-
34
-
35
-
36
-
37
-
 38
38 -
 39
39 -
 40
40 -
 41
41 -
 42
42 -
 43
43 -
 44
44 -
 45
45 -
 46
46 -
 47
47 -
 48
48 -
 49
49 -
 50
50 -
 51
51 -
 52
52 -
 53
53 -
 54
54 -
 55
55 -
 56
56 -
 57
57 -
 58
58 -
59
-
60
-
61
-
62
-
63
-
64
-
65
-
66
-
67
-
68
-
69
-
70
-
71
-
72
-
73
-
74
-
75
-
76
-
77
-
78
-
79
-
80
-
81
-
82
-
83
-
84
-
85
-
86
-
87
-
88
-
89
-
90
-
91
-
92
-
93
-
94
-
95
-
96
-
97
-
98
-
99
-
100
-
101
-
102
-
103
-
104
 |
 |
CIRCUIT CITY STORES, INC. ANNUAL REPORT 2002 46
TABLE 1 2002 2001 2000
Weighted Average Weighted Average Weighted Average
(Shares in thousands) Shares Exercise Price Shares Exercise Price Shares Exercise Price
Circuit City Group:
Outstanding at beginning of year............. 8,720 $28.59 7,380 $25.07 8,894 $18.25
Granted .................................................... 4,423 12.80 4,280 34.80 1,564 40.75
Exercised................................................... (541) 15.45 (1,526) 23.64 (2,864) 12.65
Cancelled.................................................. (611) 23.96 (1,414) 34.25 (214) 22.06
Outstanding at end of year....................... 11,991 $23.60 8,720 $28.60 7,380 $25.07
Options exercisable at end of year ............ 4,346 $25.33 3,158 $21.86 1,258 $13.89
CarMax Group:
Outstanding at beginning of year............. 4,107 $ 3.16 3,324 $ 3.87 4,380 $ 1.77
Granted .................................................... 1,659 4.94 1,281 1.70 1,132 5.89
Exercised................................................... (1,941) 1.32 (56) 0.22 (2,027) 0.22
Cancelled.................................................. (194) 5.95 (442) 4.67 (161) 6.94
Outstanding at end of year....................... 3,631 $ 4.81 4,107 $ 3.16 3,324 $ 3.87
Options exercisable at end of year ............ 821 $ 6.85 1,943 $ 2.94 1,203 $ 2.54
TABLE 2 Options Outstanding Options Exercisable
Weighted Average
(Shares in thousands) Number Remaining Weighted Average Number Weighted Average
Range of Exercise Prices Outstanding Contractual Life Exercise Price Exercisable Exercise Price
Circuit City Group:
$ 9.94 to 12.45........................................ 3,896 6.9 $12.41 96 $11.32
13.25 to 17.93........................................ 1,634 3.8 15.13 1,067 15.43
18.00 to 27.95........................................ 1,243 3.0 20.18 1,037 19.86
29.50 ...................................................... 1,000 0.1 29.50 1,000 29.50
30.48 to 43.03........................................ 4,218 5.7 36.82 1,146 37.03
Total ......................................................... 11,991 5.1 $23.60 4,346 $25.33
CarMax Group:
$ 1.63 ...................................................... 962 5.0 $ 1.63 193 $ 1.63
3.22 to 4.89........................................ 1,648 5.9 4.82 25 3.66
6.06 to 9.06........................................ 794 4.2 6.37 387 6.51
9.19 to 14.00........................................ 141 2.9 11.09 136 11.02
15.00 to 22.47........................................ 86 2.5 15.42 80 15.08
Total ......................................................... 3,631 5.1 $ 4.81 821 $ 6.85
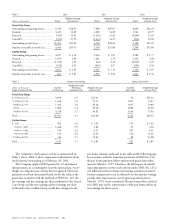
The Company’s stock option activity is summarized in
Table 1 above. Table 2 above summarizes information about
stock options outstanding as of February 28, 2002.
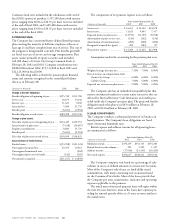
The Company applies APB Opinion No. 25 and related
interpretations in accounting for its stock option plans. Accor-
dingly, no compensation cost has been recognized. Had com-
pensation cost been determined based on the fair value at the
grant date consistent with the methods of SFAS No. 123, the
net earnings and net earnings per share attributed to the Circuit
City Group and the net earnings and net earnings per share
attributed to the CarMax Group would have changed to the
pro forma amounts indicated in the table on the following page.
In accordance with the transition provisions of SFAS No. 123,
the pro forma amounts reflect options with grant dates subse-
quent to March 1, 1995. Therefore, the full impact of calculat-
ing compensation cost for stock options under SFAS No. 123 is
not reflected in the pro forma net earnings amounts presented
because compensation cost is reflected over the options’ vesting
periods and compensation cost of options granted prior to
March 1, 1995, is not considered. The pro forma effect on fiscal
year 2002 may not be representative of the pro forma effects on
net earnings for future years.