CarMax 2002 Annual Report Download - page 88
Download and view the complete annual report
Please find page 88 of the 2002 CarMax annual report below. You can navigate through the pages in the report by either clicking on the pages listed below, or by using the keyword search tool below to find specific information within the annual report.-
 1
1 -
2
-
3
-
4
-
5
-
6
-
7
-
8
-
9
-
10
-
11
-
12
-
13
-
14
-
15
-
16
-
17
-
18
-
19
-
20
-
21
-
22
-
23
-
24
-
25
-
26
-
27
-
28
-
29
-
30
-
31
-
32
-
33
-
34
-
35
-
36
-
37
-
38
-
39
-
40
-
41
-
42
-
43
-
44
-
45
-
46
-
47
-
48
-
49
-
50
-
51
-
52
-
53
-
54
-
55
-
56
-
57
-
58
-
59
-
60
-
61
-
62
-
63
-
64
-
65
-
66
-
67
-
68
-
69
-
70
-
71
-
72
-
73
-
74
-
75
-
76
-
77
-
 78
78 -
 79
79 -
 80
80 -
 81
81 -
 82
82 -
 83
83 -
 84
84 -
 85
85 -
 86
86 -
 87
87 -
 88
88 -
 89
89 -
 90
90 -
 91
91 -
 92
92 -
 93
93 -
 94
94 -
 95
95 -
 96
96 -
 97
97 -
 98
98 -
99
-
100
-
101
-
102
-
103
-
104
 |
 |

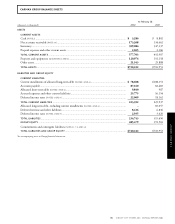
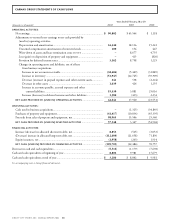
CARMAX GROUP STATEMENTS OF CASH FLOWS
CIRCUIT CITY STORES, INC. ANNUAL REPORT 2002 86
Years Ended February 28 or 29
(Amounts in thousands) 2002 2001 2000
OPERATING ACTIVITIES:
Net earnings...................................................................................................... $ 90,802 $ 45,564 $ 1,118
Adjustments to reconcile net earnings to net cash provided by
(used in) operating activities:
Depreciation and amortization..................................................................... 16,340 18,116 15,241
Unearned compensation amortization of restricted stock.............................. 100 154 447
Write-down of assets and lease termination costs [NOTE 9] ............................. –8,677 4,755
Loss (gain) on disposition of property and equipment.................................. –415 (820)
Provision for deferred income taxes .............................................................. 3,162 8,758 1,225
Changes in operating assets and liabilities, net of effects
from business acquisitions:
Increase in net accounts receivable........................................................... (38,606) (5,409) (31,889)
Increase in inventory ............................................................................... (51,947) (62,745) (39,909)
Decrease (increase) in prepaid expenses and other current assets .............. 241 538 (2,224)
Decrease in other assets ........................................................................... 1,639 424 1,255
Increase in accounts payable, accrued expenses and other
current liabilities................................................................................. 19,330 3,881 25,016
Increase (decrease) in deferred revenue and other liabilities...................... 1,580 (413) 2,234
NET CASH PROVIDED BY (USED IN) OPERATING ACTIVITIES ............................ 42,641 17,960 (23,551)
INVESTING ACTIVITIES:
Cash used in business acquisitions..................................................................... –(1,325) (34,849)
Purchases of property and equipment................................................................ (41,417) (10,834) (45,395)
Proceeds from sales of property and equipment, net.......................................... 98,965 15,506 25,340
NET CASH PROVIDED BY (USED IN) INVESTING ACTIVITIES ............................. 57,548 3,347 (54,904)
FINANCING ACTIVITIES:
Increase (decrease) in allocated short-term debt, net.......................................... 8,853 (565) (3,053)
(Decrease) increase in allocated long-term debt, net .......................................... (112,600) (21,658) 71,896
Equity issuances, net ......................................................................................... (1,958) (263) 1,914
NET CASH (USED IN) PROVIDED BY FINANCING ACTIVITIES ............................ (105,705) (22,486) 70,757
Decrease in cash and cash equivalents .................................................................... (5,516) (1,179) (7,698)
Cash and cash equivalents at beginning of year ...................................................... 8,802 9,981 17,679
Cash and cash equivalents at end of year................................................................ $ 3,286 $ 8,802 $ 9,981
See accompanying notes to Group financial statements.