CarMax 2002 Annual Report Download - page 24
Download and view the complete annual report
Please find page 24 of the 2002 CarMax annual report below. You can navigate through the pages in the report by either clicking on the pages listed below, or by using the keyword search tool below to find specific information within the annual report.-
 1
1 -
2
-
3
-
4
-
5
-
6
-
7
-
8
-
9
-
10
-
11
-
12
-
13
-
 14
14 -
 15
15 -
 16
16 -
 17
17 -
 18
18 -
 19
19 -
 20
20 -
 21
21 -
 22
22 -
 23
23 -
 24
24 -
 25
25 -
 26
26 -
 27
27 -
 28
28 -
 29
29 -
 30
30 -
 31
31 -
 32
32 -
 33
33 -
 34
34 -
35
-
36
-
37
-
38
-
39
-
40
-
41
-
42
-
43
-
44
-
45
-
46
-
47
-
48
-
49
-
50
-
51
-
52
-
53
-
54
-
55
-
56
-
57
-
58
-
59
-
60
-
61
-
62
-
63
-
64
-
65
-
66
-
67
-
68
-
69
-
70
-
71
-
72
-
73
-
74
-
75
-
76
-
77
-
78
-
79
-
80
-
81
-
82
-
83
-
84
-
85
-
86
-
87
-
88
-
89
-
90
-
91
-
92
-
93
-
94
-
95
-
96
-
97
-
98
-
99
-
100
-
101
-
102
-
103
-
104
 |
 |

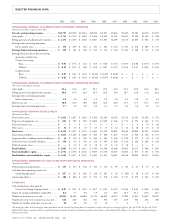
CIRCUIT CITY STORES, INC. ANNUAL REPORT 2002 22
2002 2001 2000 1999 1998 1997 1996 1995 1994 1993
CONSOLIDATED SUMMARY OF EARNINGS FROM CONTINUING OPERATIONS
(Amounts in millions except per share data)
Net sales and operating revenues........................ $12,791 $12,959 $12,614 $10,810 $ 8,871 $7,664 $7,029 $5,583 $4,130 $3,270
Gross profit........................................................... $ 2,732 $ 2,795 $ 2,863 $ 2,456 $ 2,044 $1,761 $1,635 $1,385 $1,106 $ 924
Selling, general and administrative expenses.......... $ 2,373 $ 2,515 $ 2,310 $ 2,087 $ 1,815 $1,499 $1,315 $1,105 $ 892 $ 745
Earnings from continuing operations
before income taxes......................................... $ 353 $ 259 $ 529 $ 341 $ 202 $ 233 $ 295 $ 270 $ 209 $ 175
Earnings from continuing operations ................ $ 219 $ 161 $ 328 $ 211 $ 125 $ 144 $ 184 $ 169 $ 132 $ 110
Earnings (loss) per share from continuing
operations attributed to:
Circuit City Group:
Basic.......................................................... $ 0.93 $ 0.73 $ 1.63 $ 1.09 $ 0.68 $ 0.74 $ 0.95 $ 0.88 $ 0.70 $ 0.59
Diluted...................................................... $ 0.92 $ 0.73 $ 1.60 $ 1.08 $ 0.67 $ 0.73 $ 0.94 $ 0.87 $ 0.69 $ 0.58
CarMax Group:
Basic.......................................................... $ 0.87 $ 0.45 $ 0.01 $ (0.24) $ (0.35) $ (0.01) $ — $ — $ — $ —
Diluted...................................................... $ 0.82 $ 0.43 $ 0.01 $ (0.24) $ (0.35) $ (0.01) $ — $ — $ — $ —
CONSOLIDATED SUMMARY OF EARNINGS FROM CONTINUING OPERATIONS PERCENTS
(% to sales except effective tax rate)
Gross profit........................................................... 21.4 21.6 22.7 22.7 23.0 23.0 23.3 24.8 26.8 28.3
Selling, general and administrative expenses.......... 18.6 19.4 18.3 19.3 20.5 19.6 18.7 19.8 21.6 22.8
Earnings from continuing operations
before income taxes......................................... 2.8 2.0 4.2 3.2 2.3 3.0 4.2 4.8 5.1 5.4
Effective tax rate ................................................... 38.0 38.0 38.0 38.0 38.0 38.0 37.5 37.5 36.7 37.0
Earnings from continuing operations.................... 1.7 1.2 2.6 2.0 1.4 1.9 2.6 3.0 3.2 3.4
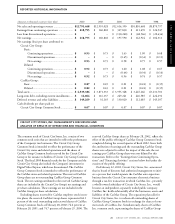
CONSOLIDATED SUMMARY BALANCE SHEETS
(Amounts in millions)
Total current assets................................................ $ 3,653 $ 2,847 $ 2,943 $ 2,394 $ 2,146 $2,163 $1,736 $1,387 $1,024 $ 791
Property and equipment, net ................................ $ 854 $ 989 $ 965 $ 1,006 $ 1,049 $ 886 $ 774 $ 593 $ 438 $ 371
Deferred income taxes........................................... $—$—$—$—$—$—$—$6$79$88
Other assets........................................................... $32$ 35 $ 47 $ 45 $ 37 $ 32 $ 16 $ 18 $ 14 $ 13
Total assets........................................................... $ 4,539 $ 3,871 $ 3,955 $ 3,445 $ 3,232 $3,081 $2,526 $2,004 $1,555 $1,263
Total current liabilities .......................................... $ 1,641 $ 1,292 $ 1,406 $ 964 $ 906 $ 837 $ 831 $ 706 $ 546 $ 373
Long-term debt, excluding current installments..... $14$ 116 $ 249 $ 426 $ 424 $ 430 $ 399 $ 179 $ 30 $ 82
Deferred revenue and other liabilities.................... $ 150 $ 92 $ 130 $ 112 $ 145 $ 166 $ 214 $ 242 $ 268 $ 232
Deferred income taxes........................................... $—$ 15$ 28$ 38 $ 27 $33 $18 $— $— $—
Total liabilities..................................................... $ 1,805 $ 1,515 $ 1,813 $ 1,540 $ 1,502 $1,466 $1,462 $1,127 $ 844 $ 687
Total stockholders’ equity................................... $ 2,734 $ 2,356 $ 2,142 $ 1,905 $ 1,730 $1,615 $1,064 $ 877 $ 711 $ 576
Total liabilities and stockholders’ equity............ $ 4,539 $ 3,871 $ 3,955 $ 3,445 $ 3,232 $3,081 $2,526 $2,004 $1,555 $1,263
CONSOLIDATED STATEMENTS OF CASH FLOWS FROM CONTINUING OPERATIONS
(Amounts in millions)
Depreciation and amortization.............................. $ 151 $ 153 $ 148 $ 130 $ 115 $ 99 $ 80 $ 67 $ 55 $ 42
Cash flow from operating activities of
continuing operations ..................................... $ 837 $ 167 $ 638 $ 328 $ 241 $ 30 $ (43) $ 54 $ 114 $ 166
Capital expenditures ............................................. $ 180 $ 286 $ 222 $ 352 $ 576 $ 540 $ 517 $ 375 $ 252 $ 190
OTHER DATA
Cash dividends per share paid on
Circuit City Group Common Stock ............... $ 0.07 $ 0.07 $ 0.07 $ 0.07 $ 0.07 $ 0.07 $ 0.06 $ 0.05 $ 0.04 $ 0.03
Return on average stockholders’ equity (%) .......... 8.6 7.1 9.8 7.9 6.2 10.2 18.5 21.1 20.6 21.5
Number of Associates at year-end ......................... 52,035 56,865 60,083 53,710 46,691 42,312 37,086 31,413 23,625 20,107
Number of Circuit City retail units at year-end ..... 624 629 616 587 556 493 419 352 294 260
Number of CarMax retail units at year-end........... 40 404031187421—
All earnings per share and dividend per share calculations for the Circuit City Group have been adjusted to reflect a two-for-one stock split effective June 30, 1999. On June 16, 1999,
Digital Video Express announced that it would discontinue operations. Results of continuing operations shown above exclude Digital Video Express. See notes to consolidated and group
financial statements.
SELECTED FINANCIAL DATA