CarMax 2002 Annual Report Download - page 49
Download and view the complete annual report
Please find page 49 of the 2002 CarMax annual report below. You can navigate through the pages in the report by either clicking on the pages listed below, or by using the keyword search tool below to find specific information within the annual report.-
 1
1 -
2
-
3
-
4
-
5
-
6
-
7
-
8
-
9
-
10
-
11
-
12
-
13
-
14
-
15
-
16
-
17
-
18
-
19
-
20
-
21
-
22
-
23
-
24
-
25
-
26
-
27
-
28
-
29
-
30
-
31
-
32
-
33
-
34
-
35
-
36
-
37
-
38
-
 39
39 -
 40
40 -
 41
41 -
 42
42 -
 43
43 -
 44
44 -
 45
45 -
 46
46 -
 47
47 -
 48
48 -
 49
49 -
 50
50 -
 51
51 -
 52
52 -
 53
53 -
 54
54 -
 55
55 -
 56
56 -
 57
57 -
 58
58 -
 59
59 -
60
-
61
-
62
-
63
-
64
-
65
-
66
-
67
-
68
-
69
-
70
-
71
-
72
-
73
-
74
-
75
-
76
-
77
-
78
-
79
-
80
-
81
-
82
-
83
-
84
-
85
-
86
-
87
-
88
-
89
-
90
-
91
-
92
-
93
-
94
-
95
-
96
-
97
-
98
-
99
-
100
-
101
-
102
-
103
-
104
 |
 |

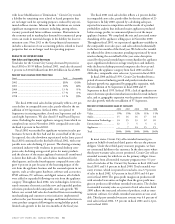
47 CIRCUIT CITY STORES, INC. ANNUAL REPORT 2002
CIRCUIT CITY STORES, INC.
(Amounts in thousands Years Ended February 28 or 29
except per share data) 2002 2001 2000
Circuit City Group:
Earnings from continuing
operations:
As reported............................... $190,799 $149,247 $327,574
Pro forma................................. 174,654 136,957 319,337
Net earnings:
As reported............................... $190,799 $149,247 $197,334
Pro forma................................. 174,654 136,957 189,097
Earnings per share from
continuing operations:
Basic – as reported ................... $ 0.93 $ 0.73 $ 1.63
Basic – pro forma..................... 0.85 0.67 1.59
Diluted – as reported ............... 0.92 0.73 1.60
Diluted – pro forma................. 0.84 0.67 1.56
Net earnings per share:
Basic – as reported ................... $ 0.93 $ 0.73 $ 0.98
Basic – pro forma..................... 0.85 0.67 0.94
Diluted – as reported ............... 0.92 0.73 0.96
Diluted – pro forma................. 0.84 0.67 0.93
CarMax Group:
Net earnings:
As reported............................... $ 27,996 $ 11,555 $ 256
Pro forma................................. 27,522 11,345 75
Net earnings per share:
Basic – as reported ................... $ 0.87 $ 0.45 $ 0.01
Basic – pro forma..................... 0.86 0.44 0.00
Diluted – as reported ............... 0.82 0.43 0.01
Diluted – pro forma................. 0.81 0.42 0.00
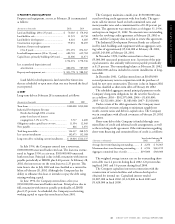
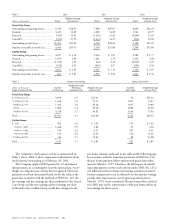
For the purpose of computing the pro forma amounts indi-
cated above, the fair value of each option on the date of grant
was estimated using the Black-Scholes option-pricing model.
The weighted average assumptions used in the model were
as follows:
2002 2001 2000
Circuit City Group:
Expected dividend yield.......................... 0.6% 0.2% 0.2%
Expected stock volatility ......................... 62% 49% 38%
Risk-free interest rates............................. 5% 6% 6%
Expected lives (in years).......................... 5 5 5
CarMax Group:
Expected dividend yield.......................... – – –
Expected stock volatility ......................... 79% 71% 62%
Risk-free interest rates............................. 5% 7% 6%
Expected lives (in years).......................... 4 4 4
Using these assumptions in the Black-Scholes model, the
weighted average fair value of options granted for the Circuit
City Group was $7 per share in fiscal 2002, $17 per share in fis-
cal 2001 and $17 per share in fiscal 2000; and for the CarMax
Group, $3 per share in fiscal 2002, $1 per share in fiscal 2001
and $3 per share in fiscal 2000.
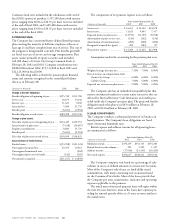
7. EARNINGS PER SHARE
Reconciliations of the numerator and denominator of basic and
diluted earnings per share are presented below.
(Amounts in thousands Years Ended February 28 or 29
except per share data) 2002 2001 2000
Circuit City Group:
Weighted average
common shares ........................ 205,501 203,774 201,345
Dilutive potential
common shares:
Options.................................... 773 885 2,145
Restricted stock........................ 821 1,171 831
Weighted average common
shares and dilutive
potential common shares ......... 207,095 205,830 204,321
Earnings from continuing
operations available to
common shareholders .............. $190,799 $149,247 $327,574
Basic earnings per share from
continuing operations .............. $ 0.93 $ 0.73 $ 1.63
Diluted earnings per share from
continuing operations .............. $ 0.92 $ 0.73 $ 1.60
CarMax Group:
Weighted average
common shares ........................ 32,140 25,554 23,778
Dilutive potential common shares:
Options.................................... 1,949 1,332 1,814
Restricted stock........................ 33 94 196
Weighted average common
shares and dilutive potential
common shares ........................ 34,122 26,980 25,788
Net earnings available to
common shareholders .............. $ 27,996 $ 11,555 $ 256
Basic net earnings per share ........... $ 0.87 $ 0.45 $ 0.01
Diluted net earnings per share....... $ 0.82 $ 0.43 $ 0.01
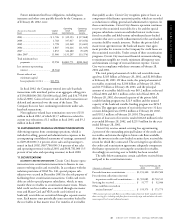
Certain options were outstanding and not included in the
computation of diluted earnings per share because the options’
exercise prices were greater than the average market price of the
common shares. Options to purchase 5,253,600 shares of
Circuit City Group Common Stock with exercise prices ranging
from $26.15 to $43.03 per share were outstanding and not
included in the calculation at the end of fiscal 2002; 8,469,700
shares with exercise prices ranging from $14.75 to $47.53 per
share at the end of fiscal 2001; and 2,900 shares with exercise
prices ranging from $43.03 to $47.53 per share at the end of fis-
cal 2000. All options to purchase shares of CarMax Group