CarMax 2002 Annual Report Download - page 81
Download and view the complete annual report
Please find page 81 of the 2002 CarMax annual report below. You can navigate through the pages in the report by either clicking on the pages listed below, or by using the keyword search tool below to find specific information within the annual report.-
 1
1 -
2
-
3
-
4
-
5
-
6
-
7
-
8
-
9
-
10
-
11
-
12
-
13
-
14
-
15
-
16
-
17
-
18
-
19
-
20
-
21
-
22
-
23
-
24
-
25
-
26
-
27
-
28
-
29
-
30
-
31
-
32
-
33
-
34
-
35
-
36
-
37
-
38
-
39
-
40
-
41
-
42
-
43
-
44
-
45
-
46
-
47
-
48
-
49
-
50
-
51
-
52
-
53
-
54
-
55
-
56
-
57
-
58
-
59
-
60
-
61
-
62
-
63
-
64
-
65
-
66
-
67
-
68
-
69
-
70
-
 71
71 -
 72
72 -
 73
73 -
 74
74 -
 75
75 -
 76
76 -
 77
77 -
 78
78 -
 79
79 -
 80
80 -
 81
81 -
 82
82 -
 83
83 -
 84
84 -
 85
85 -
 86
86 -
 87
87 -
 88
88 -
 89
89 -
 90
90 -
 91
91 -
92
-
93
-
94
-
95
-
96
-
97
-
98
-
99
-
100
-
101
-
102
-
103
-
104
 |
 |

79 CIRCUIT CITY STORES, INC. ANNUAL REPORT 2002
CARMAX GROUP
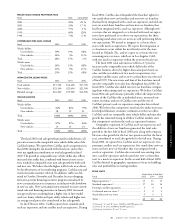
PERCENT SALES CHANGE FROM PRIOR YEAR
Fiscal Total Comparable
2002 ...................................................................... 28% 28)%
2001 ...................................................................... 24% 17)%
2000 ...................................................................... 37% 2)%
1999 ...................................................................... 68% (2)%
1998 ...................................................................... 71% 6)%
COMPARABLE STORE SALES CHANGE
Fiscal 2002 2001 2000
Vehicle dollars:
Used vehicles ............................ 30% 19% (4)%
New vehicles............................. 24% 9% 50)%
Total............................................... 28% 17% 2)%
Vehicle units:
Used vehicles ............................ 24% 13% (8)%
New vehicles............................. 21% 9% 49)%
Total............................................... 23% 12% (4)%
AVERAGE RETAIL SELLING PRICES
Fiscal 2002 2001 2000
Used vehicles .................................. $15,100 $14,400 $13,700
New vehicles .................................. $23,100 $22,600 $22,500
Blended average.............................. $16,200 $15,500 $14,900
VEHICLE SALES MIX
Fiscal 2002 2001 2000
Vehicle dollars:
Used vehicles ............................ 82% 81% 79%
New vehicles............................. 18 19 21
Total............................................... 100% 100% 100%
Vehicle units:
Used vehicles ............................ 87% 87% 86%
New vehicles............................. 13 13 14
Total............................................... 100% 100% 100%
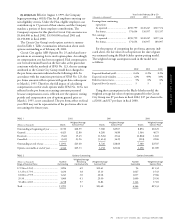
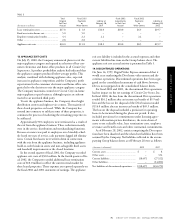
The fiscal 2002 total sales growth primarily resulted from a 28
percent increase in the comparable store vehicle dollar sales of the
CarMax business. We opened two CarMax used-car superstores in
fiscal 2002 during the last month of the fiscal year, and so they
were not significant contributors to total sales growth in fiscal
2002. The growth in comparable store vehicle dollar sales reflects
increased store traffic that, combined with better in-store execu-
tion, resulted in comparable store unit sales growth for both used
and new cars. We believe that the higher traffic levels were driven
by the effectiveness of our marketing programs, CarMax.com and
word-of-mouth customer referrals. In addition, traffic was bol-
stered in October, November and December by cross-shopping
from zero-percent financing incentive programs introduced by
new-car manufacturers to counteract an industry-wide slowdown
in new-car sales. New-car manufacturers returned to more conven-
tional sales and financing incentives in January 2002. Increased
average retail prices resulting from a higher mix of later-model
used cars, luxury vehicles and sport utility vehicles and higher new-
car average retail prices also contributed to the sales growth.
In late February 2002, CarMax opened one standard-sized
used-car superstore and one satellite used-car superstore. During
fiscal 2002, CarMax also relinquished the franchise rights for
one stand-alone new-car franchise and one new-car franchise
that had been integrated with a used-car superstore and sold one
new-car stand-alone franchise and one new-car franchise that
had been integrated with a used-car superstore. Although new-
car stores that are integrated or co-located with used-car super-
stores have performed at or above our expectations, the three
remaining stand-alone new-car stores are still performing below
our expectations. We intend to integrate or co-locate these
stores with used-car superstores. We expect this integration or
co-location to occur within the next fiscal year for the store
located in Orlando, Fla., and we expect to co-locate the two
remaining new-car stores, which are in Los Angeles, Calif.,
with one used-car superstore within the next two fiscal years.
The fiscal 2001 total sales increase reflects a 17 percent
increase in the comparable store vehicle dollar sales of the
CarMax business, driven by higher-than-anticipated used-car
sales, and the net addition of two used-car superstores, two
prototype satellite stores and six new-car franchises since the end
of fiscal 1999. The new stores and four of the franchises moved
into the comparable store sales base throughout fiscal 2001. In
fiscal 2001, CarMax also added two new-car franchises, integrat-
ing them with existing used-car superstores. We believe CarMax’s
fiscal 2001 sales performance primarily reflects the improved exe-
cution of the CarMax offer at individual stores, increased con-
sumer awareness and use of CarMax.com and the exit of
CarMax’s primary used-car superstore competitor late in fiscal
2000. We believe this competitor’s exit from five multi-store mar-
kets helped eliminate consumer confusion over the two offers.
CarMax’s used-car comparable store vehicle dollar and unit sales
growth has remained strong in all these CarMax markets since
this competitor’s exit from the used-car superstore business.
Geographic expansion of CarMax used-car superstores and
the addition of new-car franchises generated the total sales
growth in the first half of fiscal 2000 and, along with compara-
ble store sales growth for the last two quarters and for the fiscal
year, contributed to total sales growth for the full year. During
fiscal 2000, we opened two CarMax used-car superstores, two
prototype satellite used-car superstores, five stand-alone new-car
stores and one new-car franchise that was integrated with a
used-car superstore. CarMax also converted one existing store
into a satellite operation and relocated one new-car franchise
next to a used-car superstore. In the second half of fiscal 2000,
CarMax limited its geographic expansion to focus on building
sales and profitability in existing markets.
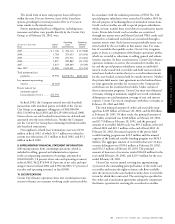
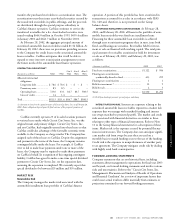
RETAIL UNITS
Retail Units at Year-End
Fiscal 2002 2001 2000
Mega superstores (1)................................................ 13 13 13
Standard superstores (2) .......................................... 17 16 16
Prototype satellite superstores................................ 5 4 4
Co-located new-car stores (3) .................................. 2 2 2
Stand-alone new-car stores .................................... 3 5 5
Total...................................................................... 40 40 40
(1) Formerly “C” and “B” stores; 70,000 to 100,000 square feet.
(2) Formerly “A” stores; 40,000 to 60,000 square feet.
(3) Formerly included as “A” and “C” stores.