Capital One 2000 Annual Report Download - page 66
Download and view the complete annual report
Please find page 66 of the 2000 Capital One annual report below. You can navigate through the pages in the report by either clicking on the pages listed below, or by using the keyword search tool below to find specific information within the annual report.-
 1
1 -
2
-
3
-
4
-
5
-
6
-
7
-
8
-
9
-
10
-
11
-
12
-
13
-
14
-
15
-
16
-
17
-
18
-
19
-
20
-
21
-
22
-
23
-
24
-
25
-
26
-
27
-
28
-
29
-
30
-
31
-
32
-
33
-
34
-
35
-
36
-
37
-
38
-
39
-
40
-
41
-
42
-
43
-
44
-
45
-
46
-
47
-
48
-
49
-
50
-
51
-
52
-
53
-
54
-
55
-
 56
56 -
 57
57 -
 58
58 -
 59
59 -
 60
60 -
 61
61 -
 62
62 -
 63
63 -
 64
64 -
 65
65 -
 66
66 -
 67
67 -
 68
68 -
 69
69 -
 70
70
 |
 |

64 notes
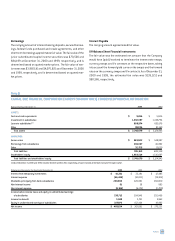
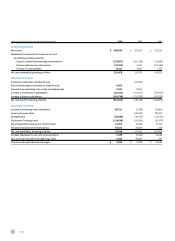
Statements of Cash Flows for the Year Ended December 31 2000 1999 1998
OPERATING ACTIVITIES:
Net income $ 469,634 $ 363,091 $ 275,231
Adjustments to reconcile net income to net cash
provided by operating activities:
Equity in undistributed earnings of subsidiaries (227,873) (152,424) (19,902)
(Increase) decrease in other assets (37,400) 4,236 (56,682)
Increase in other liabilities 19,117 2,604 1,365
Net cash provided by operating activities 223,478 217,507 200,012
INVESTING ACTIVITIES:
Purchases of securities available for sale (26,836)
Proceeds from sales of securities available for sale 8,455
Proceeds from maturities of securities available for sale 6,832 11,658
Increase in investment in subsidiaries (117,123) (115,233) (172,119)
Increase in loans to subsidiaries (199,798) (233,780) (167,889)
Net cash used for investing activities (301,634) (364,191) (340,008)
FINANCING ACTIVITIES:
Increase in borrowings from subsidiaries 157,711 (7,398) 50,900
Issuance of senior notes 224,684 199,213
Dividends paid (20,824) (20,653) (20,533)
Purchases of treasury stock (134,619) (107,104) (91,672)
Net proceeds from issuances of common stock 21,076 14,028 12,143
Proceeds from exercise of stock options 58,250 38,086 629
Net cash provided by financing activities 81,594 141,643 150,680
Increase (decrease) in cash and cash equivalents 3,438 (5,041) 10,684
Cash and cash equivalents at beginning of year 5,846 10,887 203
Cash and cash equivalents at end of year $ 9,284 $ 5,846 $ 10,887