Capital One 2000 Annual Report Download - page 34
Download and view the complete annual report
Please find page 34 of the 2000 Capital One annual report below. You can navigate through the pages in the report by either clicking on the pages listed below, or by using the keyword search tool below to find specific information within the annual report.-
 1
1 -
2
-
3
-
4
-
5
-
6
-
7
-
8
-
9
-
10
-
11
-
12
-
13
-
14
-
15
-
16
-
17
-
18
-
19
-
20
-
21
-
22
-
23
-
 24
24 -
 25
25 -
 26
26 -
 27
27 -
 28
28 -
 29
29 -
 30
30 -
 31
31 -
 32
32 -
 33
33 -
 34
34 -
 35
35 -
 36
36 -
 37
37 -
 38
38 -
 39
39 -
 40
40 -
 41
41 -
 42
42 -
 43
43 -
 44
44 -
45
-
46
-
47
-
48
-
49
-
50
-
51
-
52
-
53
-
54
-
55
-
56
-
57
-
58
-
59
-
60
-
61
-
62
-
63
-
64
-
65
-
66
-
67
-
68
-
69
-
70
 |
 |

32 md&a
The 30-plus day delinquency
rate for the reported consumer loan
portfolio increased to 7.26% as of
December 31, 2000, from 5.92% as
of December 31, 1999. The increase
in the reported delinquency rate is a
result of a shift in the composition
of the reported portfolio combined
with the seasoning of accounts. The
30-plus day delinquency rate for the
managed consumer loan portfolio
remained consistent at 5.23% as of
December 31, 2000 and 1999.
Changes in the rates of delinquency and credit losses can also
result from a shift in the product mix. As discussed in "Risk Adjusted
Revenue and Margin," certain customized card products have, in
some cases, higher delinquency and higher charge-off rates. In the
case of secured card loans, collateral, in the form of cash deposits,
reduces any ultimate charge-offs. The costs associated with higher
delinquency and charge-off rates are considered in the pricing of
individual products.
During 2000, general economic conditions for consumer credit
remained stable as industry levels of charge-offs (including bank-
ruptcies) and delinquencies both decreased. These trends have
positively impacted the Company's 2000 results.
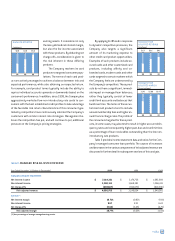
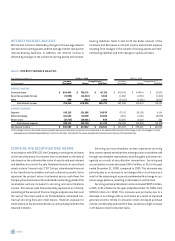
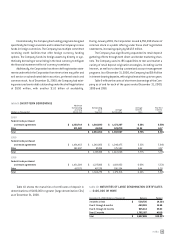
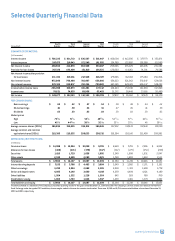
DELINQUENCIES
Table 6 shows the Company's consumer loan delinquency trends
for the years presented on a reported and managed basis. The
entire balance of an account is contractually delinquent if the
minimum payment is not received by the payment due date. Delin-
quencies not only have the potential to impact earnings if the
account charges off, they also are costly in terms of the personnel
and other resources dedicated to resolving the delinquencies.
table 6: DELINQUENCIES
December 31 2000 1999 1998 1997 1996
% of % of % of % of % of
Total Total Total Total Total
(Dollars in Thousands) Loans Loans Loans Loans Loans Loans Loans Loans Loans Loans
REPORTED:
Loans outstanding $ 15,112,712 100.00% $ 9,913,549 100.00% $ 6,157,111 100.00% $ 4,861,687 100.00% $ 4,343,902 100.00%
Loans delinquent:
30–59 days 418,967 2.77 236,868 2.39 123,162 2.00 104,216 2.14 96,819 2.23
60–89 days 242,770 1.61 129,251 1.30 67,504 1.10 64,217 1.32 55,679 1.28
90 or more days 435,574 2.88 220,513 2.23 98,798 1.60 99,667 2.05 111,791 2.57
Total $ 1,097,311 7.26% $ 586,632 5.92% $ 289,464 4.70% $ 268,100 5.51% $ 264,289 6.08%
MANAGED:
Loans outstanding $ 29,524,026 100.00% $ 20,236,588 100.00% $ 17,395,126 100.00% $ 14,231,015 100.00% $ 12,803,969 100.00%
Loans delinquent:
30–59 days 605,040 2.05 416,829 2.06 329,239 1.89 327,407 2.30 279,787 2.19
60–89 days 349,250 1.18 238,476 1.18 182,982 1.05 213,726 1.50 162,668 1.27
90 or more days 590,364 2.00 403,464 1.99 305,589 1.76 340,887 2.40 356,700 2.78
Total $ 1,544,654 5.23% $ 1,058,769 5.23% $ 817,810 4.70% $ 882,020 6.20% $ 799,155 6.24%