Capital One 2000 Annual Report Download - page 65
Download and view the complete annual report
Please find page 65 of the 2000 Capital One annual report below. You can navigate through the pages in the report by either clicking on the pages listed below, or by using the keyword search tool below to find specific information within the annual report.-
 1
1 -
2
-
3
-
4
-
5
-
6
-
7
-
8
-
9
-
10
-
11
-
12
-
13
-
14
-
15
-
16
-
17
-
18
-
19
-
20
-
21
-
22
-
23
-
24
-
25
-
26
-
27
-
28
-
29
-
30
-
31
-
32
-
33
-
34
-
35
-
36
-
37
-
38
-
39
-
40
-
41
-
42
-
43
-
44
-
45
-
46
-
47
-
48
-
49
-
50
-
51
-
52
-
53
-
54
-
 55
55 -
 56
56 -
 57
57 -
 58
58 -
 59
59 -
 60
60 -
 61
61 -
 62
62 -
 63
63 -
 64
64 -
 65
65 -
 66
66 -
 67
67 -
 68
68 -
 69
69 -
 70
70
 |
 |

notes 63
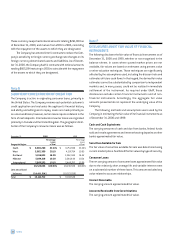
Borrowings
The carrying amount of interest-bearing deposits, secured borrow-
ings, federal funds purchased and resale agreements, and other
short-term borrowings approximates fair value. The fair value of the
junior subordinated capital income securities was $70,500 and
$84,199 at December 31, 2000 and 1999, respectively, and is
determined based on quoted market prices. The fair value of sen-
ior notes was $3,987,116 and $4,075,825 as of December 31, 2000
and 1999, respectively, and is determined based on quoted mar-
ket prices.
Interest Payable
The carrying amount approximated fair value.
Off-Balance Sheet Financial Instruments
The fair value was the estimated net amount that the Company
would have (paid)/received to terminate the interest rate swaps,
currency swaps and f/x contracts at the respective dates, taking
into account the forward yield curve on the swaps and the forward
rates on the currency swaps and f/x contracts. As of December 31,
2000 and 1999, the estimated fair value was $(39,121) and
$80,566, respectively.
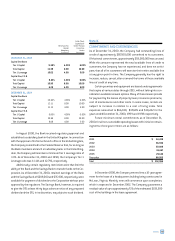
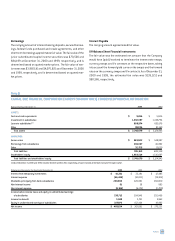
Note Q
CAPITAL ONE FINANCIAL CORPORATION (PARENT COMPANY ONLY) CONDENSED FINANCIAL INFORMATION
Balance Sheets at December 31 2000 1999
ASSETS:
Cash and cash equivalents $ 9,284 $ 5,846
Investment in subsidiaries 1,832,387 1,428,754
Loans to subsidiaries(1) 808,974 609,176
Other 98,034 81,169
Total assets $2,748,679 $2,124,945
LIABILITIES:
Senior notes $ 549,042 $548,897
Borrowings from subsidiaries 204,367 46,802
Other 32,756 13,639
Total liabilities 786,165 609,338
Stockholders’ equity 1,962,514 1,515,607
Total liabilities and stockholders’ equity $2,748,679 $2,124,945
(1) As of December 31, 2000 and 1999, includes $63,220 and $11,350, respectively, of cash invested at the Bank instead of the open market.
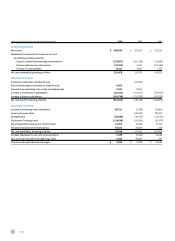
Statements of Income for the Year Ended December 31 2000 1999 1998
Interest from temporary investments $41,321 $32,191 $12,485
Interest expense (46,486) (41,011) (18,212)
Dividends, principally from bank subsidiaries 250,000 220,001 260,000
Non-interest income 61 39 893
Non-interest expense (8,184) (6,274) (2,700)
Income before income taxes and equity in undistributed earnings
of subsidiaries 236,712 204,946 252,466
Income tax benefit 5,049 5,721 2,863
Equity in undistributed earnings of subsidiaries 227,873 152,424 19,902
Net income $ 469,634 $ 363,091 $ 275,231