Capital One 2000 Annual Report Download - page 30
Download and view the complete annual report
Please find page 30 of the 2000 Capital One annual report below. You can navigate through the pages in the report by either clicking on the pages listed below, or by using the keyword search tool below to find specific information within the annual report.-
 1
1 -
2
-
3
-
4
-
5
-
6
-
7
-
8
-
9
-
10
-
11
-
12
-
13
-
14
-
15
-
16
-
17
-
18
-
19
-
 20
20 -
 21
21 -
 22
22 -
 23
23 -
 24
24 -
 25
25 -
 26
26 -
 27
27 -
 28
28 -
 29
29 -
 30
30 -
 31
31 -
 32
32 -
 33
33 -
 34
34 -
 35
35 -
 36
36 -
 37
37 -
 38
38 -
 39
39 -
 40
40 -
41
-
42
-
43
-
44
-
45
-
46
-
47
-
48
-
49
-
50
-
51
-
52
-
53
-
54
-
55
-
56
-
57
-
58
-
59
-
60
-
61
-
62
-
63
-
64
-
65
-
66
-
67
-
68
-
69
-
70
 |
 |

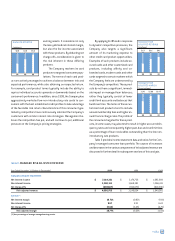
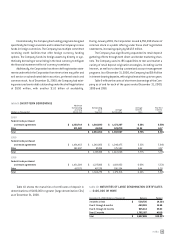
NET INTEREST INCOME
Net interest income is interest and past-due fees earned from the
Company's consumer loans and securities less interest expense
on borrowings, which include interest-bearing deposits, other
borrowings and borrowings from senior notes.
Reported net interest income for the year ended December 31,
2000, was $1.6 billion compared to $1.1 billion for 1999, repre-
senting an increase of $536.3 million, or 51%. Net interest income
increased as a result of both growth in earning assets and an
increase in the net interest margin. Average earning assets increased
37% for the year ended December 31, 2000, to $13.3 billion from
$9.7 billion for the year ended December 31, 1999. The reported net
interest margin increased to 11.99% in 2000, from 10.86% in 1999
primarily attributable to a 58 basis point increase in the yield on
consumer loans to 19.91% for the year ended December 31, 2000,
from 19.33% for the year ended December 31, 1999. The yield on
consumer loans increased primarily due to an increase in the fre-
quency of past-due fees and a slight shift in the mix of the portfolio
to higher yielding assets as compared to the prior year.
The managed net interest margin for the year ended December
31, 2000, decreased to 10.71% from 10.83% for the year ended
December 31, 1999. This decrease was primarily the result of an
increase of 74 basis points in borrowing costs to 6.53% in 2000,
from 5.79% in 1999, offset by a 24 basis point increase in consumer
loan yield for the year ended December 31, 2000. The increase in
consumer loan yield to 17.83% for the year ended December 31,
2000, from 17.59% in 1999 was primarily the result of an increase
in the frequency of past-due fees as compared to the prior year.
Reported net interest income for the year ended December 31,
1999, was $1.1 billion, compared to $687.3 million for 1998, repre-
senting an increase of $365.4 million, or 53%. Net interest income
increased as a result of both growth in earning assets and an
increase in the net interest margin. Average earning assets increased
34% for the year ended December 31, 1999, to $9.7 billion from $7.2
billion for the year ended December 31, 1998. The reported net
interest margin increased to 10.86% in 1999, from 9.51% in 1998
and was primarily attributable to a 58 basis point increase in the
yield on consumer loans to 19.33% for the year ended December
31, 1999, from 18.75% for the year ended December 31, 1998. The
yield on consumer loans increased primarily due to an increase in
the amount and frequency of past-due fees as compared to the
prior year, continued growth in the Company’s portfolio of higher
yielding products and repricings of low introductory rate loans dur-
ing late 1998 and early 1999.
The managed net interest margin for the year ended Decem-
ber 31, 1999, increased to 10.83% from 9.91% for the year ended
December 31, 1998. This increase was primarily the result of a 60
basis point increase in consumer loan yield for the year ended
December 31, 1999, as well as a decrease of 26 basis points in bor-
rowing costs to 5.79% in 1999, from 6.05% in 1998. The increase
in consumer loan yield to 17.59% for the year ended December 31,
1999, from 16.99% in 1998 principally reflected increases in the
amount and frequency of past-due fees and growth in higher yield-
ing loans.
Table 4 provides average balance sheet data, an analysis of
net interest income, net interest spread (the difference between
the yield on earning assets and the cost of interest-bearing liabili-
ties) and net interest margin for each of the years ended December
31, 2000, 1999 and 1998.
28 md&a