Capital One 2000 Annual Report Download - page 49
Download and view the complete annual report
Please find page 49 of the 2000 Capital One annual report below. You can navigate through the pages in the report by either clicking on the pages listed below, or by using the keyword search tool below to find specific information within the annual report.-
 1
1 -
2
-
3
-
4
-
5
-
6
-
7
-
8
-
9
-
10
-
11
-
12
-
13
-
14
-
15
-
16
-
17
-
18
-
19
-
20
-
21
-
22
-
23
-
24
-
25
-
26
-
27
-
28
-
29
-
30
-
31
-
32
-
33
-
34
-
35
-
36
-
37
-
38
-
 39
39 -
 40
40 -
 41
41 -
 42
42 -
 43
43 -
 44
44 -
 45
45 -
 46
46 -
 47
47 -
 48
48 -
 49
49 -
 50
50 -
 51
51 -
 52
52 -
 53
53 -
 54
54 -
 55
55 -
 56
56 -
 57
57 -
 58
58 -
 59
59 -
60
-
61
-
62
-
63
-
64
-
65
-
66
-
67
-
68
-
69
-
70
 |
 |

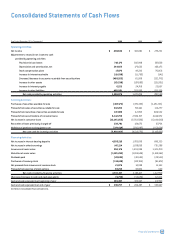
Year Ended December 31 (In Thousands) 2000 1999 1998
Operating Activities:
Net income $ 469,634 $ 363,091 $ 275,231
Adjustments to reconcile net income to cash
provided by operating activities:
Provision for loan losses 718,170 382,948 267,028
Depreciation and amortization, net 244,823 172 ,623 108,173
Stock compensation plans 17,976 49,236 70,056
Increase in interest receivable (18,038) (11,720) (141)
(Increase) decrease in accounts receivable from securitizations (468,205) 65,208 (133,771)
Increase in other assets (63,538) (157,685) (121,951)
Increase in interest payable 6,253 24,768 22,667
Increase in other liabilities 489,001 383,820 293,266
Net cash provided by operating activities 1,396,076 1,272,289 780,558
Investing Activities:
Purchases of securities available for sale (407,572) (871,355) (1,251,713)
Proceeds from sales of securities available for sale 432,203 719,161 112,277
Proceeds from maturities of securities available for sale 172,889 42,995 606,532
Proceeds from securitizations of consumer loans 6,142,709 2,586,517 4,616,972
Net increase in consumer loans (12,145,055) (6,763,580) (6,144,640)
Recoveries of loans previously charged off 239,781 124,673 67,764
Additions of premises and equipment, net (374,018) (350,987) (153,024)
Net cash used for investing activities (5,939,063) (4,512,576) (2,145,832)
Financing Activities:
Net increase in interest-bearing deposits 4,595,216 1,783,830 686,325
Net increase in other borrowings 145,214 1,038,010 735,288
Issuances of senior notes 994,176 1,453,059 1,323,700
Maturities of senior notes (1,125,292) (1,012,639) (1,218,162)
Dividends paid (20,824) (20,653) (20,533)
Purchases of treasury stock (134,619) (107,104) (91,672)
Net proceeds from issuances of common stock 21,076 14,028 12,143
Proceeds from exercise of stock options 58,250 38,086 629
Net cash provided by financing activities 4,533,197 3,186,617 1,427,718
(Decrease) increase in cash and cash equivalents (9,790) (53,670) 62,444
Cash and cash equivalents at beginning of year 246,497 300,167 237,723
Cash and cash equivalents at end of year $ 236,707 $ 246,497 $ 300,167
See Notes to Consolidated Financial Statements.
Consolidated Statements of Cash Flows
financial statements 47