Capital One 2000 Annual Report Download - page 46
Download and view the complete annual report
Please find page 46 of the 2000 Capital One annual report below. You can navigate through the pages in the report by either clicking on the pages listed below, or by using the keyword search tool below to find specific information within the annual report.-
 1
1 -
2
-
3
-
4
-
5
-
6
-
7
-
8
-
9
-
10
-
11
-
12
-
13
-
14
-
15
-
16
-
17
-
18
-
19
-
20
-
21
-
22
-
23
-
24
-
25
-
26
-
27
-
28
-
29
-
30
-
31
-
32
-
33
-
34
-
35
-
 36
36 -
 37
37 -
 38
38 -
 39
39 -
 40
40 -
 41
41 -
 42
42 -
 43
43 -
 44
44 -
 45
45 -
 46
46 -
 47
47 -
 48
48 -
 49
49 -
 50
50 -
 51
51 -
 52
52 -
 53
53 -
 54
54 -
 55
55 -
 56
56 -
57
-
58
-
59
-
60
-
61
-
62
-
63
-
64
-
65
-
66
-
67
-
68
-
69
-
70
 |
 |

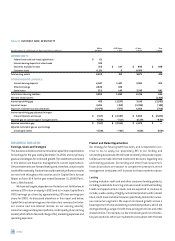
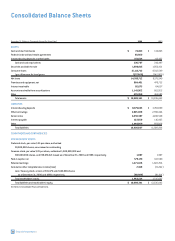
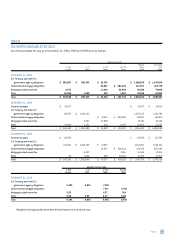
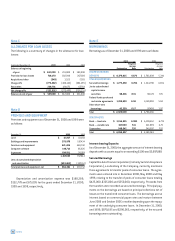
December 31 (Dollars in Thousands, Except Per Share Data) 2000 1999
ASSETS:
Cash and due from banks $ 74,493 $134,065
Federal funds sold and resale agreements 60,600
Interest-bearing deposits at other banks 101,614 112,432
Cash and cash equivalents 236,707 246,497
Securities available for sale 1,696,815 1,856,421
Consumer loans 15,112,712 9,913,549
Less: Allowance for loan losses (527,000) (342,000)
Net loans 14,585,712 9,571,549
Premises and equipment, net 664,461 470,732
Interest receivable 82,675 64,637
Accounts receivable from securitizations 1,143,902 661,922
Other 479,069 464,685
Total assets $ 18,889,341 $ 13,336,443
LIABILITIES:
Interest-bearing deposits $ 8,379,025 $ 3,783,809
Other borrowings 2,925,938 2,780,466
Senior notes 4,050,597 4,180,548
Interest payable 122,658 116,405
Other 1,448,609 959,608
Total liabilities 16,926,827 11,820,836
COMMITMENTS AND CONTINGENCIES
STOCKHOLDERS’ EQUITY:
Preferred stock, par value $.01 per share; authorized
50,000,000 shares, none issued or outstanding
Common stock, par value $.01 per share; authorized 1,000,000,000 and
300,000,000 shares, and 199,670,421 issued as of December 31, 2000 and 1999, respectively 1,997 1,997
Paid-in capital, net 575,179 613,590
Retained earnings 1,471,106 1,022,296
Cumulative other comprehensive income (loss) 2,918 (31,262)
Less: Treasury stock, at cost; 2,301,476 and 2,624,006 shares
as of December 31, 2000 and 1999, respectively (88,686) (91,014)
Total stockholders’ equity 1,962,514 1,515,607
Total liabilities and stockholders’ equity $ 18,889,341 $ 13,336,443
See Notes to Consolidated Financial Statements.
Consolidated Balance Sheets
44 financial statements