Capital One 2000 Annual Report Download - page 47
Download and view the complete annual report
Please find page 47 of the 2000 Capital One annual report below. You can navigate through the pages in the report by either clicking on the pages listed below, or by using the keyword search tool below to find specific information within the annual report.-
 1
1 -
2
-
3
-
4
-
5
-
6
-
7
-
8
-
9
-
10
-
11
-
12
-
13
-
14
-
15
-
16
-
17
-
18
-
19
-
20
-
21
-
22
-
23
-
24
-
25
-
26
-
27
-
28
-
29
-
30
-
31
-
32
-
33
-
34
-
35
-
36
-
 37
37 -
 38
38 -
 39
39 -
 40
40 -
 41
41 -
 42
42 -
 43
43 -
 44
44 -
 45
45 -
 46
46 -
 47
47 -
 48
48 -
 49
49 -
 50
50 -
 51
51 -
 52
52 -
 53
53 -
 54
54 -
 55
55 -
 56
56 -
 57
57 -
58
-
59
-
60
-
61
-
62
-
63
-
64
-
65
-
66
-
67
-
68
-
69
-
70
 |
 |

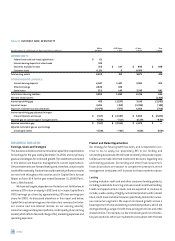
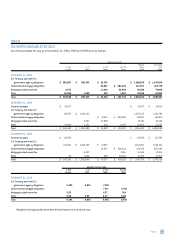
Year Ended December 31 (In Thousands, Except Per Share Data) 2000 1999 1998
Interest Income:
Consumer loans, including fees $ 2,286,774 $ 1,482,371 $ 1,003,122
Securities available for sale 96,554 105,438 94,436
Other 6,574 5,675 13,978
Total interest income 2,389,902 1,593,484 1,111,536
Interest Expense:
Deposits 324,008 13 7, 79 2 67, 4 7 9
Other borrowings 202,034 100,392 96,130
Senior notes 274,975 302,698 260,675
Total interest expense 801,017 540,882 424,284
Net interest income 1,588,885 1,052,602 687,252
Provision for loan losses 718,170 382,948 267,028
Net interest income after provision for loan losses 870,715 669,654 420,224
Non-Interest Income:
Servicing and securitizations 1,152,375 1,187,098 789,844
Service charges and other customer-related fees 1,644,264 1,040,944 611,958
Interchange 237,777 144,317 86,481
Total non-interest income 3,034,416 2,372,359 1,488,283
Non-Interest Expense:
Salaries and associate benefits 1,023,367 780,160 476,389
Marketing 906,147 731,898 446,264
Communications and data processing 296,255 264,897 150,220
Supplies and equipment 252,937 181,663 112,101
Occupancy 112,667 72,275 45,337
Other 556,284 434,103 234,275
Total non-interest expense 3,147,657 2,464,996 1,464,586
Income before income taxes 757,474 577,017 443,921
Income taxes 287,840 213,926 168,690
Net income $ 469,634 $ 363,091 $ 275,231
Basic earnings per share $ 2.39 $1.84$1.40
Diluted earnings per share $ 2.24 $1.72$1.32
Dividends paid per share $0.11$ 0.11 $ 0.11
See Notes to Consolidated Financial Statements.
Consolidated Statements of Income
financial statements 45