Capital One 2000 Annual Report Download - page 33
Download and view the complete annual report
Please find page 33 of the 2000 Capital One annual report below. You can navigate through the pages in the report by either clicking on the pages listed below, or by using the keyword search tool below to find specific information within the annual report.-
 1
1 -
2
-
3
-
4
-
5
-
6
-
7
-
8
-
9
-
10
-
11
-
12
-
13
-
14
-
15
-
16
-
17
-
18
-
19
-
20
-
21
-
22
-
 23
23 -
 24
24 -
 25
25 -
 26
26 -
 27
27 -
 28
28 -
 29
29 -
 30
30 -
 31
31 -
 32
32 -
 33
33 -
 34
34 -
 35
35 -
 36
36 -
 37
37 -
 38
38 -
 39
39 -
 40
40 -
 41
41 -
 42
42 -
 43
43 -
44
-
45
-
46
-
47
-
48
-
49
-
50
-
51
-
52
-
53
-
54
-
55
-
56
-
57
-
58
-
59
-
60
-
61
-
62
-
63
-
64
-
65
-
66
-
67
-
68
-
69
-
70
 |
 |

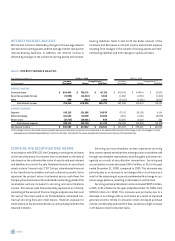
Certain estimates inherent in the determination of the fair
value of the I/O strip are influenced by factors outside the Com-
pany's control, and as a result, such estimates could materially
change in the near term. Any future gains that will be recognized in
accordance with SFAS 125 and SFAS 140 (see Note A to the Consol-
idated Financial Statements) will be dependent on the timing and
amount of future securitizations. The Company will continuously
assess the performance of new and existing securitization trans-
actions as estimates of future cash flows change.
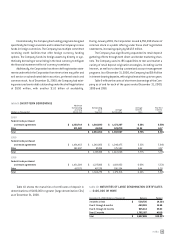
OTHER NON-INTEREST INCOME
Interchange income increased $93.5 million, or 65%, to $237.8
million for the year ended December 31, 2000, from $144.3 million
in 1999. Service charges and other customer-related fees increased
to $1.6 billion, or 58%, for the year ended December 31, 2000,
compared to $1.0 billion for the year ended December 31, 1999.
These increases were primarily due to a 41% increase in the average
number of accounts for the year ended December 31, 2000, from
1999, an increase in purchase volume, customer usage patterns
and increased purchases of cross-sell products.
Interchange income increased $57.8 million, or 67%, to $144.3
million for the year ended December 31, 1999, from $86.5 million
in 1998. Service charges and other customer-related fees increased
to $1.0 billion, or 70%, for the year ended December 31, 1999, com-
pared to $612.0 million for the year ended December 31, 1998.
These increases were primarily due to a 42% increase in the aver-
age number of accounts for the year ended December 31, 1999,
from 1998, an increase in purchase volume, an increase in inter-
change rates received by the Company and a shift to more
fee-intensive products.
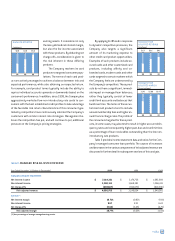
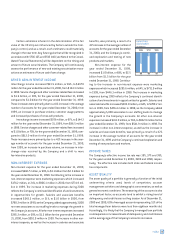
NON-INTEREST EXPENSE
Non-interest expense for the year ended December 31, 2000,
increased $682.7 million, or 28%, to $3.1 billion from $2.5 billion for
the year ended December 31, 1999. Contributing to the increase in
non-interest expense were marketing expenses which increased
$174.2 million, or 24%, to $906.1 million in 2000, from $731.9 mil-
lion in 1999. The increase in marketing expenses during 2000
reflects the Company's continued identification of and investments
in opportunities for growth. Salaries and associate benefits
increased $243.2 million, or 31%, to $1.0 billion in 2000, from
$780.2 million in 1999, as the Company added approximately 3,800
net new associates to our staffing levels to manage the growth in
the Company's accounts. All other non-interest expenses increased
$265.2 million, or 28%, to $1.2 billion for the year ended December
31, 2000, from $952.9 million in 1999. The increase in other non-
interest expense, as well as the increase in salaries and associate
benefits, was primarily a result of a
41% increase in the average number of
accounts for the year ended December
31, 2000, and the Company's contin-
ued exploration and testing of new
products and markets.
Non-interest expense for the
year ended December 31, 1999,
increased $1.0 billion, or 68%, to $2.5
billion from $1.5 billion for the year
ended December 31, 1998. Contribut-
ing to the increase in non-interest expense were marketing
expenses which increased $285.6 million, or 64%, to $731.9 million
in 1999, from $446.3 million in 1998. The increase in marketing
expenses during 1999 reflects the Company's continued identifi-
cation of and investments in opportunities for growth. Salaries and
associate benefits increased $303.8 million, or 64%, to $780.2 mil-
lion in 1999, from $476.4 million in 1998, as the Company added
approximately 5,000 associates to our staffing levels to manage
the growth in the Company's accounts. All other non-interest
expenses increased $411.0 million, or 76%, to $952.9 million for the
year ended December 31, 1999, from $541.9 million in 1998. The
increase in other non-interest expense, as well as the increase in
salaries and associate benefits, was primarily a result of a 42%
increase in the average number of accounts for the year ended
December 31, 1999 and the Company's continued exploration and
testing of new products and markets.
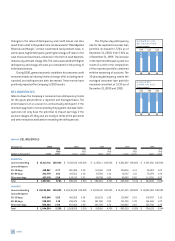
INCOME TAXES
The Company's effective income tax rate was 38%, 37% and 38%,
for the years ended December 31, 2000, 1999 and 1998, respec-
tively. The effective rate includes both state and federal income
tax components.
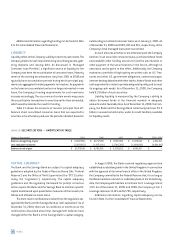
ASSET QUALITY
The asset quality of a portfolio is generally a function of the initial
underwriting criteria used, levels of competition, account
management activities and demographic concentration, as well as
general economic conditions. The seasoning of the accounts is also
an important factor, as accounts tend to exhibit a rising trend of
delinquency and credit losses as they season. As of December 31,
2000 and 1999, 60% of managed accounts representing 51% of the
total managed loan balance were less than eighteen months old.
Accordingly, it is likely that the Company's managed loan portfolio
could experience increased levels of delinquency and credit losses
as the average age of the Company's accounts increases.
md&a 31