Capital One 2000 Annual Report Download - page 32
Download and view the complete annual report
Please find page 32 of the 2000 Capital One annual report below. You can navigate through the pages in the report by either clicking on the pages listed below, or by using the keyword search tool below to find specific information within the annual report.-
 1
1 -
2
-
3
-
4
-
5
-
6
-
7
-
8
-
9
-
10
-
11
-
12
-
13
-
14
-
15
-
16
-
17
-
18
-
19
-
20
-
21
-
 22
22 -
 23
23 -
 24
24 -
 25
25 -
 26
26 -
 27
27 -
 28
28 -
 29
29 -
 30
30 -
 31
31 -
 32
32 -
 33
33 -
 34
34 -
 35
35 -
 36
36 -
 37
37 -
 38
38 -
 39
39 -
 40
40 -
 41
41 -
 42
42 -
43
-
44
-
45
-
46
-
47
-
48
-
49
-
50
-
51
-
52
-
53
-
54
-
55
-
56
-
57
-
58
-
59
-
60
-
61
-
62
-
63
-
64
-
65
-
66
-
67
-
68
-
69
-
70
 |
 |

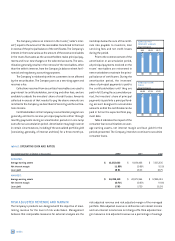
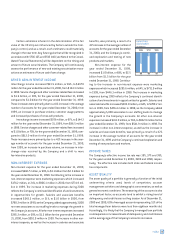
SERVICING AND SECURITIZATIONS INCOME
In accordance with SFAS 125, the Company records gains or losses
on the securitizations of consumer loan receivables on the date of
sale based on the estimated fair value of assets sold and retained
and liabilities incurred in the sale. Retained interests in securitized
assets include "interest only" ("I/O") strips, subordinated interests
in the transferred receivables and cash collateral accounts. Gains
represent the present value of estimated excess cash flows the
Company has retained over the estimated outstanding period of the
receivables and are included in servicing and securitizations
income. This excess cash flow essentially represents an I/O strip,
consisting of the excess of finance charges and past-due fees over
the sum of the return paid to certificateholders, estimated con-
tractual servicing fees and credit losses. However, exposure to
credit losses on the securitized loans is contractually limited to the
retained interests.
Servicing and securitizations income represents servicing
fees, excess spread and other fees relating to loan receivables sold
through securitization transactions, as well as gains and losses rec-
ognized as a result of securitization transactions. Servicing and
securitizations income decreased $34.7 million, or 3%, for the year
ended December 31, 2000, compared to 1999. This decrease was
primarily due to an increase in net charge-offs on such loans as a
result of the seasoning of accounts combined with a change in cus-
tomer usage patterns, resulting in decreases in certain fees.
Servicing and securitizations income increased $397.3 million,
or 50%, to $1.2 billion for the year ended December 31, 1999, from
$789.8 million for 1998. This increase was primarily due to a
decrease in net charge-offs on such loans as a result of improved
general economic trends in consumer credit, increased purchase
volume, membership and overlimit fees, as well as a slight increase
in off-balance sheet consumer loans.
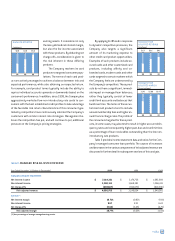
30 md&a
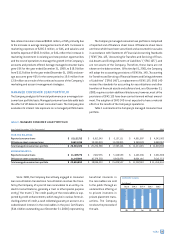
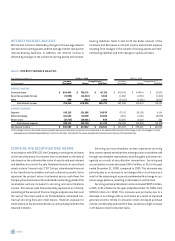
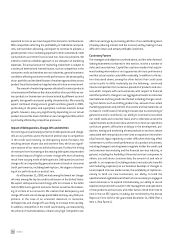
table 5: INTEREST VARIANCE ANALYSIS
Year Ended December 31 2000 vs. 1999 1999 vs. 1998
Increase Change Due to(1) Increase Change Due to(1)
(In Thousands) (Decrease) Volume Yield/Rate (Decrease) Volume Yield/Rate
INTEREST INCOME:
Consumer loans $ 804,403 $ 759,271 $ 45,132 $ 479,249 $ 447,414 $ 31,835
Securities available for sale (8,884) (14,244) 5,360 11,002 12,814 (1,812)
Other 899 (765) 1,664 (8,303) (3,466) (4,837)
Total interest income 796,418 629,696 166,722 481,948 401,413 80,535
INTEREST EXPENSE:
Deposits 186,216 151,286 34,930 70,313 66,199 4,114
Other borrowings 101,642 81,806 19,836 4,262 13,140 (8,878)
Senior notes (27,723) (28,681) 958 42,023 41,619 404
Total interest expense 260,135 218,759 41,376 116,598 131,870 (15,272)
Net interest income(1) $ 536,283 $ 417,642 $ 118,641 $ 365,350 $ 258,291 $ 107,059
(1) The change in interest due to both volume and yield/rates has been allocated in proportion to the relationship to the absolute dollar amounts of the change in each. The changes in income
and expense are calculated independently for each line in the table. The totals for the volume and yield/rate columns are not the sum of the individual lines.
INTEREST VARIANCE ANALYSIS
Net interest income is affected by changes in the average interest
rate earned on earning assets and the average interest rate paid on
interest-bearing liabilities. In addition, net interest income is
affected by changes in the volume of earning assets and interest-
bearing liabilities. Table 5 sets forth the dollar amount of the
increases and decreases in interest income and interest expense
resulting from changes in the volume of earning assets and inter-
est-bearing liabilities and from changes in yields and rates.