Capital One 2000 Annual Report Download - page 43
Download and view the complete annual report
Please find page 43 of the 2000 Capital One annual report below. You can navigate through the pages in the report by either clicking on the pages listed below, or by using the keyword search tool below to find specific information within the annual report.-
 1
1 -
2
-
3
-
4
-
5
-
6
-
7
-
8
-
9
-
10
-
11
-
12
-
13
-
14
-
15
-
16
-
17
-
18
-
19
-
20
-
21
-
22
-
23
-
24
-
25
-
26
-
27
-
28
-
29
-
30
-
31
-
32
-
 33
33 -
 34
34 -
 35
35 -
 36
36 -
 37
37 -
 38
38 -
 39
39 -
 40
40 -
 41
41 -
 42
42 -
 43
43 -
 44
44 -
 45
45 -
 46
46 -
 47
47 -
 48
48 -
 49
49 -
 50
50 -
 51
51 -
 52
52 -
 53
53 -
54
-
55
-
56
-
57
-
58
-
59
-
60
-
61
-
62
-
63
-
64
-
65
-
66
-
67
-
68
-
69
-
70
 |
 |

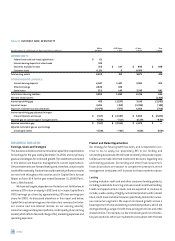
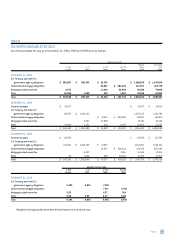
quarterly financial data 41
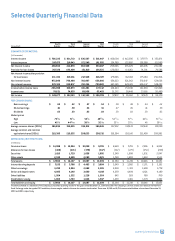
Selected Quarterly Financial Data
2000 1999
Fourth Third Second First Fourth Third Second First
(Unaudited) Quarter Quarter Quarter Quarter Quarter Quarter Quarter Quarter
SUMMARY OF OPERATIONS:
(In Thousands)
Interest income $ 706,235 $ 631,713 $ 536,507 $ 515,447 $ 450,604 $ 412,036 $ 377,773 $ 353,071
Interest expense 247,675 218,843 172,549 161,950 154,798 135,807 128,288 121,989
Net interest income 458,560 412,870 363,958 353,497 295,806 276,229 249,485 231,082
Provision for loan losses 247,226 193,409 151,010 126,525 120,000 114,061 74,301 74,586
Net interest income after provision
for loan losses 211,334 219,461 212,948 226,972 175,806 162,168 175,184 156,496
Non-interest income 872,080 796,469 710,807 655,060 654,623 621,063 572,047 524,626
Non-interest expense 876,516 818,957 742,264 709,920 681,185 629,421 606,137 548,253
Income before income taxes 206,898 196,973 181,491 172,112 149,244 153,810 141,094 132,869
Income taxes 78,621 74,850 68,966 65,403 51,372 58,448 53,616 50,490
Net income $ 128,277 $ 122,123 $ 112,525 $ 106,709 $ 97,872 $ 95,362 $ 87,478 $ 82,379
PER COMMON SHARE:
Basic earnings $.65$.62$.57$.54$.50$.48$.44$.42
Diluted earnings .61 .58 .54 .51 .47 .45 .41 .39
Dividends .03 .03 .03 .03 .03 .03 .03 .03
Market prices
High 735⁄23 713⁄4533⁄44813 ⁄16 5427 ⁄32 573⁄4601⁄65125⁄64
Low 457⁄84426⁄43 393⁄8321⁄16 357⁄8354⁄546 365⁄16
Average common shares (000s) 196,996 196,255 196,012 196,645 197,252 197,423 197,643 197,239
Average common and common
equivalent shares (000s) 210,395 210,055 208,633 208,710 210,284 210,142 211,499 209,991
AVERAGE BALANCE SHEET DATA:
(In Millions)
Consumer loans $ 14,089 $ 12,094 $ 10,029 $ 9,705 $ 8,620 $ 7,791 $ 7,406 $ 6,832
Allowance for loan losses (469) (415) (378) (347) (312) (273) (254) (239)
Securities 1,810 1,729 1,666 1,856 2,348 1,898 1,831 2,047
Other assets 2,530 2,699 2,380 1,825 1,728 1,803 1,663 1,511
Total assets $ 17,960 $ 16,107 $ 13,697 $ 13,039 $ 12,384 $ 11,219 $ 10,646 $ 10,151
Interest-bearing deposits $ 7,156 $ 5,788 $ 4,495 $ 3,894 $ 3,649 $ 3,002 $ 2,271 $ 2,101
Other borrowings 3,290 3,084 2,688 2,505 2,038 1,333 1,600 1,778
Senior and deposit notes 4,085 4,140 3,660 4,019 4,259 4,494 4,621 4,190
Other liabilities 1,564 1,352 1,228 1,054 945 929 780 780
Stockholders’ equity 1,865 1,743 1,626 1,567 1,493 1,461 1,374 1,302
Total liabilities and equity $ 17,960 $ 16,107 $ 13,697 $ 13,039 $ 12,384 $ 11,219 $ 10,646 $ 10,151
The above schedule is a tabulation of the Company’s unaudited quarterly results for the years ended December 31, 2000 and 1999. The Company’s common shares are traded on the New York
Stock Exchange under the symbol COF. In addition, shares may be traded in the over-the-counter stock market. There were 10,019 and 9,738 common stockholders of record as of December 31,
2000 and 1999, respectively.