Capital One 2000 Annual Report Download - page 10
Download and view the complete annual report
Please find page 10 of the 2000 Capital One annual report below. You can navigate through the pages in the report by either clicking on the pages listed below, or by using the keyword search tool below to find specific information within the annual report.-
 1
1 -
 2
2 -
 3
3 -
 4
4 -
 5
5 -
 6
6 -
 7
7 -
 8
8 -
 9
9 -
 10
10 -
 11
11 -
 12
12 -
 13
13 -
 14
14 -
 15
15 -
 16
16 -
 17
17 -
 18
18 -
 19
19 -
 20
20 -
 21
21 -
22
-
23
-
24
-
25
-
26
-
27
-
28
-
29
-
30
-
31
-
32
-
33
-
34
-
35
-
36
-
37
-
38
-
39
-
40
-
41
-
42
-
43
-
44
-
45
-
46
-
47
-
48
-
49
-
50
-
51
-
52
-
53
-
54
-
55
-
56
-
57
-
58
-
59
-
60
-
61
-
62
-
63
-
64
-
65
-
66
-
67
-
68
-
69
-
70
 |
 |
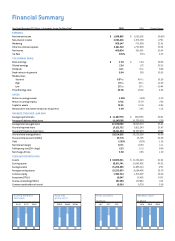
Financial Summary
Year Ended December 31 (Dollars in Thousands, Except Per Share Data) 2000 1999 Percent Change
EARNINGS:
Net interest income $ 1,588,885 $ 1,052,602 50.95%
Non-interest income 3,034,416 2,372,359 27.91
Marketing 906,147 731,898 23.81
Other non-interest expense 2,241,510 1,733,098 29.34
Net income 469,634 363,091 29.34
Tax Rate 38.0% 37.1% 2.43
PER COMMON SHARE:
Basic earnings $ 2.39 $ 1.84 29.89
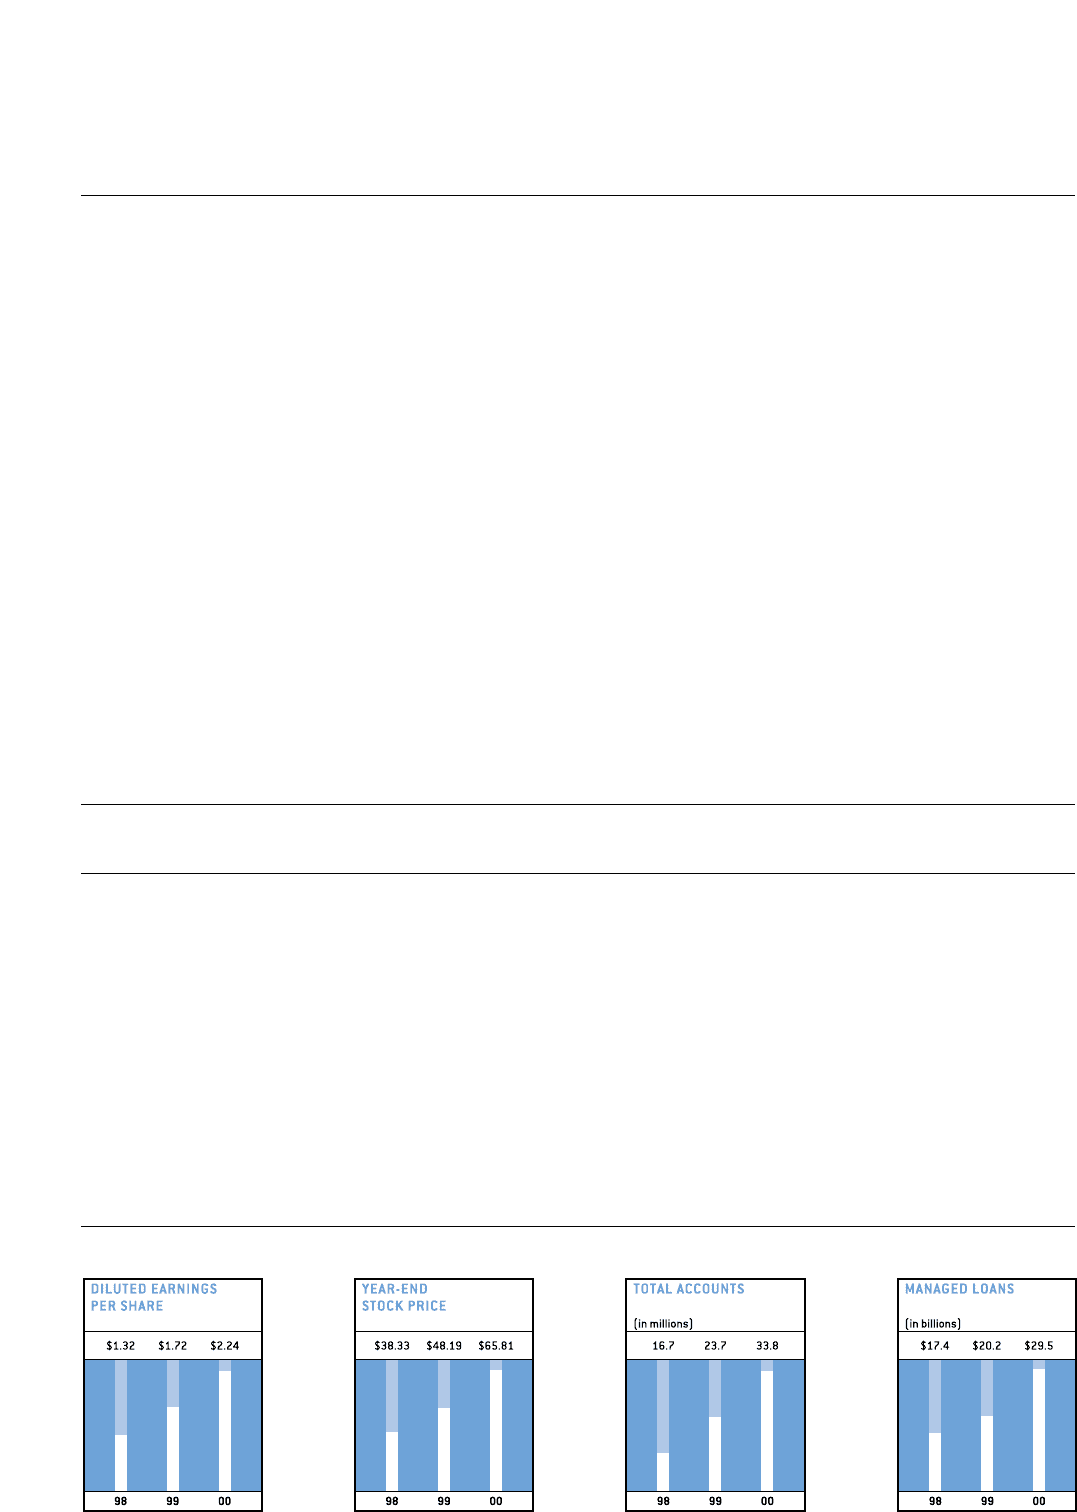
Diluted earnings 2.24 1.72 30.23
Dividends 0.11 0.11 0.00
Book value as of year-end 9.94 7.69 29.26
Market prices
Year-end 6513 ⁄16 483⁄16 36.58
High 735⁄23 601⁄621 . 69
Low 321⁄16 354⁄5–10.44
Price/Earnings ratio 29.38 28.02 4.86
RATIOS:
Return on average assets 3.09% 3.28% –5.79
Return on average equity 27.61 25.79 7.06
Capital to assets 10.91 12.10 –9.83
Allowance for loan losses to loans as of year-end 3.49 3.45 1.16
MANAGED CONSUMER LOAN DATA:
Average reported loans $ 11,487,776 $ 7,667,355 49.83
Average off-balance sheet loans 11,147,086 10,379,558 7.39
Average total managed loans 22,634,862 18,046,913 25.42
Year-end reported loans 15,112,712 9,913,549 52.45
Year-end off-balance sheet loans 14,411,314 10,323,039 39.60
Year-end total managed loans 29,524,026 20,236,588 45.89
Year-end total accounts (000s) 33,774 23,705 42.48
Yield 17.83% 17.59% -1.36
Net interest margin 10.71 10.83 -1.11
Delinquency rate (30+ days) 5.23 5.23 0.00
Net charge-off rate 3.90 3.85 1.30
YEAR-END REPORTED DATA:
Assets $ 18,889,341 $ 13,336,443 41.64
Earning assets 16,971,741 11,882,402 42.83
Average assets 15,209,585 11,085,013 37.21
Average earning assets 13,252,033 9,694,406 36.70
Common equity 1,962,514 1,515,607 29.49
Associates (FTEs) 19,247 15,426 24.77
Shares outstanding (000s) 197,369 197,046 0.16
Common stockholders of record 10,019 9,738 2.89