Capital One 2000 Annual Report Download - page 27
Download and view the complete annual report
Please find page 27 of the 2000 Capital One annual report below. You can navigate through the pages in the report by either clicking on the pages listed below, or by using the keyword search tool below to find specific information within the annual report.-
 1
1 -
2
-
3
-
4
-
5
-
6
-
7
-
8
-
9
-
10
-
11
-
12
-
13
-
14
-
15
-
16
-
 17
17 -
 18
18 -
 19
19 -
 20
20 -
 21
21 -
 22
22 -
 23
23 -
 24
24 -
 25
25 -
 26
26 -
 27
27 -
 28
28 -
 29
29 -
 30
30 -
 31
31 -
 32
32 -
 33
33 -
 34
34 -
 35
35 -
 36
36 -
 37
37 -
38
-
39
-
40
-
41
-
42
-
43
-
44
-
45
-
46
-
47
-
48
-
49
-
50
-
51
-
52
-
53
-
54
-
55
-
56
-
57
-
58
-
59
-
60
-
61
-
62
-
63
-
64
-
65
-
66
-
67
-
68
-
69
-
70
 |
 |

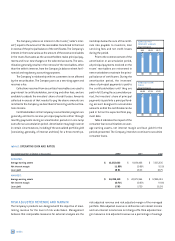
Non-interest income increased $884.1 million, or 59%, primarily due
to the increase in average managed accounts of 42%. Increases in
marketing expenses of $285.6 million, or 64%, and salaries and
benefits expense of $303.8 million, or 64%, reflect the increase in
marketing investment in existing and new product opportunities
and the cost of operations to manage the growth in the Company's
accounts and products offered. Average managed consumer loans
grew 19% for the year ended December 31, 1999, to $18.0 billion
from $15.2 billion for the year ended December 31, 1998, and aver-
age accounts grew 42% for the same period to 19.6 million from
13.8 million as a result of the continued success of the Company's
marketing and account management strategies.
MANAGED CONSUMER LOAN PORTFOLIO
The Company analyzes its financial performance on a managed con-
sumer loan portfolio basis. Managed consumer loan data adds back
the effect of off-balance sheet consumer loans. The Company also
evaluates its interest rate exposure on a managed portfolio basis.
The Company's managed consumer loan portfolio is comprised
of reported and off-balance sheet loans. Off-balance sheet loans
are those which have been securitized and accounted for as sales
in accordance with Statement of Financial Accounting Standards
("SFAS") No. 125, "Accounting for Transfers and Servicing of Finan-
cial Assets and Extinguishments of Liabilities" ("SFAS 125"), and
are not assets of the Company. Therefore, those loans are not
shown on the balance sheet. Effective April 1, 2001, the Company
will adopt the accounting provisions of SFAS No. 140, "Accounting
for Transfers and Servicing of Financial Assets and Extinguishments
of Liabilities" ("SFAS 140"), a replacement of SFAS 125. SFAS 140
revises the standards for accounting for securitizations and other
transfers of financial assets and collateral and, as of December 31,
2000, requires certain additional disclosures, however, most of the
provisions of SFAS 125 have been carried forward without amend-
ment. The adoption of SFAS 140 is not expected to have a material
effect on the results of the Company’s operations.
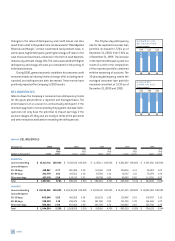
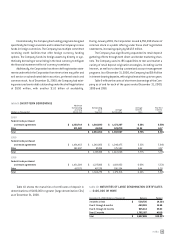
Table 1 summarizes the Company’s managed consumer loan
portfolio.
md&a 25
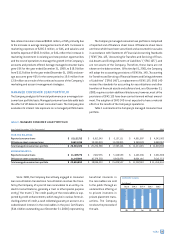
table 1: MANAGED CONSUMER LOAN PORTFOLIO
Year Ended December 31 (In Thousands) 2000 1999 1998 1997 1996
YEAR-END BALANCES:
Reported consumer loans $ 15,112,712 $ 9,913,549 $ 6,157,111 $ 4,861,687 $ 4,343,902
Off-balance sheet consumer loans 14,411,314 10,323,039 11,238,015 9,369,328 8,460,067
Total managed consumer loan portfolio $ 29,524,026 $ 20,236,588 $ 17,395,126 $ 14,231,015 $ 12,803,969
AVERAGE BALANCES:
Reported consumer loans $ 11,487,776 $ 7,667,355 $ 5,348,559 $ 4,103,036 $ 3,651,908
Off-balance sheet consumer loans 11,147,086 10,379,558 9,860,978 8,904,146 7,616,553
Total managed consumer loan portfolio $ 22,634,862 $ 18,046,913 $ 15,209,537 $ 13,007,182 $ 11,268,461
Since 1990, the Company has actively engaged in consumer
loan securitization transactions. Securitization involves the trans-
fer by the Company of a pool of loan receivables to an entity cre-
ated for securitizations, generally a trust or other special purpose
entity ("the trusts"). The credit quality of the receivables is sup-
ported by credit enhancements, which may be in various forms in-
cluding a letter of credit, a cash collateral guaranty or account, or a
subordinated interest in the receivables in the pool. Certificates
($14.4 billion outstanding as of December 31, 2000) representing
beneficial interests in
the receivables are sold
to the public through an
underwritten offering or
to private investors in
private placement trans-
actions. The Company
receives the proceeds of
the sale.