Capital One 2000 Annual Report Download - page 35
Download and view the complete annual report
Please find page 35 of the 2000 Capital One annual report below. You can navigate through the pages in the report by either clicking on the pages listed below, or by using the keyword search tool below to find specific information within the annual report.-
 1
1 -
2
-
3
-
4
-
5
-
6
-
7
-
8
-
9
-
10
-
11
-
12
-
13
-
14
-
15
-
16
-
17
-
18
-
19
-
20
-
21
-
22
-
23
-
24
-
 25
25 -
 26
26 -
 27
27 -
 28
28 -
 29
29 -
 30
30 -
 31
31 -
 32
32 -
 33
33 -
 34
34 -
 35
35 -
 36
36 -
 37
37 -
 38
38 -
 39
39 -
 40
40 -
 41
41 -
 42
42 -
 43
43 -
 44
44 -
 45
45 -
46
-
47
-
48
-
49
-
50
-
51
-
52
-
53
-
54
-
55
-
56
-
57
-
58
-
59
-
60
-
61
-
62
-
63
-
64
-
65
-
66
-
67
-
68
-
69
-
70
 |
 |

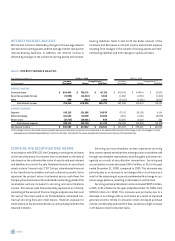
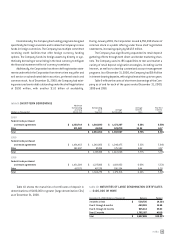
NET CHARGE-OFFS
Net charge-offs include the principal amount of losses (excluding
accrued and unpaid finance charges, fees and fraud losses) less
current period recoveries. The Company charges off credit card
loans (net of any collateral) at 180 days past the due date.
For the year ended December 31, 2000, the managed net
charge-off rate increased 5 basis points to 3.90%. For the year
ended December 31, 2000, the reported net charge-off rate
increased 105 basis points to 4.64%. The increases in managed and
reported net charge-off rates were the result of a shift in the port-
folio mix combined with the seasoning of accounts. The impact was
more apparent in the reported net charge-offs due to changes in
the composition of the reported portfolio compared to the off-balance
sheet portfolio. Table 7 shows the Company's net charge-offs for
the years presented on a reported and managed basis.
md&a 33
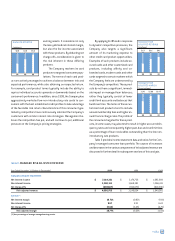
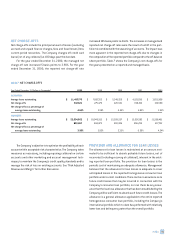
table 7: NET CHARGE-OFFS
Year Ended December 31 (Dollars in Thousands) 2000 1999 1998 1997 1996
REPORTED:
Average loans outstanding $ 11,487,776 $ 7,667,355 $ 5,348,559 $ 4,103,036 $ 3,651,908
Net charge-offs 532,621 275,470 226,531 198,192 132,590
Net charge-offs as a percentage of
average loans outstanding 4.64% 3.59% 4.24% 4.83% 3.63%
MANAGED:
Average loans outstanding $ 22,634,862 $ 18,046,913 $ 15,209,537 $ 13,007,182 $ 11,268,461
Net charge-offs 883,667 694,073 810,306 856,704 477,732
Net charge-offs as a percentage of
average loans outstanding 3.90% 3.85% 5.33% 6.59% 4.24%
The Company's objective is to optimize the profitability of each
account within acceptable risk characteristics. The Company takes
measures as necessary, including requiring collateral on certain
accounts and other marketing and account management tech-
niques, to maintain the Company's credit quality standards and to
manage the risk of loss on existing accounts. See "Risk Adjusted
Revenue and Margin" for further discussion.
PROVISION AND ALLOWANCE FOR LOAN LOSSES
The allowance for loan losses is maintained at an amount esti-
mated to be sufficient to absorb probable future losses, net of
recoveries (including recovery of collateral), inherent in the exist-
ing reported loan portfolio. The provision for loan losses is the
periodic cost of maintaining an adequate allowance. Management
believes that the allowance for loan losses is adequate to cover
anticipated losses in the reported homogeneous consumer loan
portfolio under current conditions. There can be no assurance as to
future credit losses that may be incurred in connection with the
Company's consumer loan portfolio, nor can there be any assur-
ance that the loan loss allowance that has been established by the
Company will be sufficient to absorb such future credit losses. The
allowance is a general allowance applicable to the entire reported
homogeneous consumer loan portfolio, including the Company's
international portfolio which to date has performed with relatively
lower loss and delinquency rates than the overall portfolio.