Capital One 2000 Annual Report Download - page 53
Download and view the complete annual report
Please find page 53 of the 2000 Capital One annual report below. You can navigate through the pages in the report by either clicking on the pages listed below, or by using the keyword search tool below to find specific information within the annual report.-
 1
1 -
2
-
3
-
4
-
5
-
6
-
7
-
8
-
9
-
10
-
11
-
12
-
13
-
14
-
15
-
16
-
17
-
18
-
19
-
20
-
21
-
22
-
23
-
24
-
25
-
26
-
27
-
28
-
29
-
30
-
31
-
32
-
33
-
34
-
35
-
36
-
37
-
38
-
39
-
40
-
41
-
42
-
 43
43 -
 44
44 -
 45
45 -
 46
46 -
 47
47 -
 48
48 -
 49
49 -
 50
50 -
 51
51 -
 52
52 -
 53
53 -
 54
54 -
 55
55 -
 56
56 -
 57
57 -
 58
58 -
 59
59 -
 60
60 -
 61
61 -
 62
62 -
 63
63 -
64
-
65
-
66
-
67
-
68
-
69
-
70
 |
 |

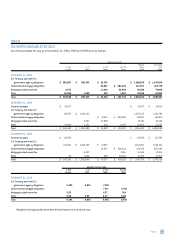
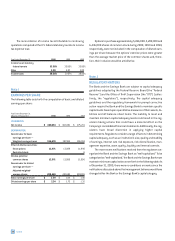
Note B
SECURITIES AVAILABLE FOR SALE
Securities available for sale as of December 31, 2000, 1999 and 1998 were as follows:
Maturity Schedule
Market Amortized
1 Year 1–5 5–10 Over 10 Value Cost
or Less Years Years Years Totals Totals
DECEMBER 31, 2000
U.S. Treasury and other U.S.
government agency obligations $ 283,607 $ 893,745 $ 10,702 $ 1,188,054 $ 1,178,386
Collateralized mortgage obligations 20,867 $ 391,240 412,107 414,770
Mortgage backed securities 3,752 11,420 61,648 76,820 74,695
Other 16,260 1,380 343 1,851 19,834 19,986
Total $ 303,619 $ 895,125 $ 43,332 $ 454,739 $ 1,696,815 $ 1,687,837
DECEMBER 31, 1999
Commercial paper $ 24,927 $ 24,927 $ 24,927
U.S. Treasury and other U.S.
government agency obligations 437,697 $ 1,014,335 1,452,032 1,471,783
Collateralized mortgage obligations $ 37,421 $ 299,846 337,267 345,619
Mortgage backed securities 5,293 13,828 19,121 19,426
Other 19,443 1,361 441 1,829 23,074 23,254
Total $ 482,067 $ 1,020,989 $ 51,690 $ 301,675 $ 1,856,421 $ 1,885,009
DECEMBER 31, 1998
Commercial paper $ 117, 395 $ 117,395 $ 117,395
U.S. Treasury and other U.S.
government agency obligations 125,831 $ 1,072,109 $ 17,051 1,214,991 1,196,313
Collateralized mortgage obligations 25,877 $ 401,443 427,320 426,485
Mortgage backed securities 8,337 7,265 15,602 15,210
Other 76 1,360 589 19,454 21,479 21,356
Total $ 243,302 $ 1,081,806 $ 43,517 $ 428,162 $ 1,796,787 $ 1,776,759
Weighted Average Yields
1 Year 1–5 5–10 Over 10
or LessYearsYearsYears
DECEMBER 31, 2000
U.S. Treasury and other U.S.
government agency obligations 5.48% 6.05% 7.04%
Collateralized mortgage obligations 7.04 6.35%
Mortgage backed securities 5.02 6.77 7.04
Other 6.09 3.93 6.47 6.89
Total 5.50% 6.05% 6.95% 6.44%
Weighted average yields were determined based on amortized cost.
notes 51