Capital One 2000 Annual Report Download - page 48
Download and view the complete annual report
Please find page 48 of the 2000 Capital One annual report below. You can navigate through the pages in the report by either clicking on the pages listed below, or by using the keyword search tool below to find specific information within the annual report.
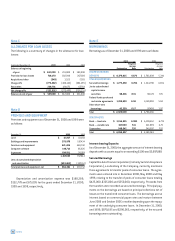
Cumulative
Other Total
Common Stock Paid-In Retained Comprehensive Treasury Stockholders’
(Dollars in Thousands, Except Per Share Data) Shares Amount Capital, Net Earnings Income (Loss) Stock Equity
Balance, December 31, 1997 199,671,690 $ 1,997 $ 512,230 $ 425,140 $ 2,539 $ (48,647) $ 893, 259
Comprehensive income:
Net income 275,231 275,231
Other comprehensive income,
net of income tax:
Unrealized gains on securities,
net of income taxes of $37,170 60,648 60,648
Foreign currency translation adjustments (2,532) (2,532)
Other comprehensive income 58,116 58,116
Comprehensive income 333,347
Cash dividends — $.11 per share (20,533) (20,533)
Purchases of treasury stock (91,672) (91,672)
Issuances of common stock 35,381 26,745 62,126
Exercise of stock options 4,500 (23,683) 43,323 19,640
Common stock issuable under incentive plan 70,038 70,038
Other items, net (5,814) 4,201 4,201
Balance, December 31, 1998 199,670,376 1,997 598,167 679,838 60,655 (70,251) 1,270,406
Comprehensive income:
Net income 363,091 363,091
Other comprehensive income,
net of income tax:
Unrealized losses on securities,
net of income tax benefits of $58,759 (95,868) (95,868)
Foreign currency translation adjustments 3,951 3,951
Other comprehensive loss (91,917) (91,917)
Comprehensive income 271,174
Cash dividends — $.11 per share (20,653) (20,653)
Purchases of treasury stock (107,104) (107,104)
Issuances of common stock(1,628) 9,833 8,205
Exercise of stock options (38,422) 76,508 38,086
Common stock issuable under incentive plan 49,236 49,236
Other items, net 45 6,237 20 6,257
Balance, December 31, 1999 199,670,421 1,997 613,590 1,022,296 (31,262) (91,014) 1,515,607
Comprehensive income:
Net income 469,634 469,634
Other comprehensive income,
net of income tax:
Unrealized gains on securities,
net of income taxes of $19,510 31,831 31,831
Foreign currency translation adjustments 2,349 2,349
Other comprehensive income 34,180 34,180
Comprehensive income 503,814
Cash dividends — $.11 per share (20,824) (20,824)
Purchases of treasury stock (134,619) (134,619)
Issuances of common stock1,441 17,436 18,877
Exercise of stock options (61,261) 119,511 58,250
Common stock issuable under incentive plan 17,976 17,976
Other items, net 3,433 3,433
Balance, December 31, 2000 199,670,421 $ 1,997 $ 575,179 $ 1,471,106 $ 2,918 $ (88,686) $ 1,962,514
See Notes to Consolidated Financial Statements.
Consolidated Statements of Changes
in Stockholders’ Equity
46 financial statements


