Avon 2010 Annual Report Download - page 98
Download and view the complete annual report
Please find page 98 of the 2010 Avon annual report below. You can navigate through the pages in the report by either clicking on the pages listed below, or by using the keyword search tool below to find specific information within the annual report.-
 1
1 -
2
-
3
-
4
-
5
-
6
-
7
-
8
-
9
-
10
-
11
-
12
-
13
-
14
-
15
-
16
-
17
-
18
-
19
-
20
-
21
-
22
-
23
-
24
-
25
-
26
-
27
-
28
-
29
-
30
-
31
-
32
-
33
-
34
-
35
-
36
-
37
-
38
-
39
-
40
-
41
-
42
-
43
-
44
-
45
-
46
-
47
-
48
-
49
-
50
-
51
-
52
-
53
-
54
-
55
-
56
-
57
-
58
-
59
-
60
-
61
-
62
-
63
-
64
-
65
-
66
-
67
-
68
-
69
-
70
-
71
-
72
-
73
-
74
-
75
-
76
-
77
-
78
-
79
-
80
-
81
-
82
-
83
-
84
-
85
-
86
-
87
-
 88
88 -
 89
89 -
 90
90 -
 91
91 -
 92
92 -
 93
93 -
 94
94 -
 95
95 -
 96
96 -
 97
97 -
 98
98 -
 99
99 -
 100
100 -
 101
101 -
 102
102 -
 103
103 -
 104
104 -
 105
105 -
 106
106 -
 107
107 -
 108
108 -
109
-
110
-
111
-
112
-
113
-
114
 |
 |

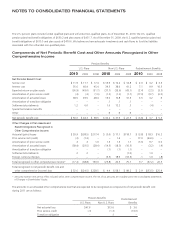
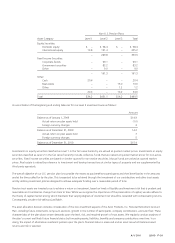
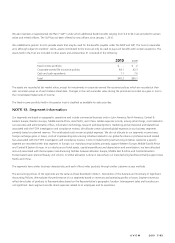
NOTES TO CONSOLIDATED FINANCIAL STATEMENTS
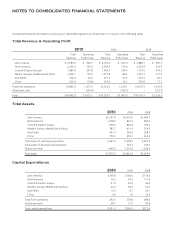
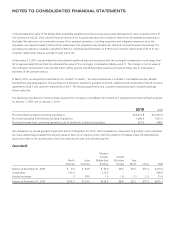
Summarized financial information concerning our reportable segments as of December 31 is shown in the following tables.
Total Revenue & Operating Profit
2010 2009 2008
Total
Revenue
Operating
Profit (Loss)
Total
Revenue
Operating
Profit (Loss)
Total
Revenue
Operating
Profit (Loss)
Latin America $ 4,589.5 $ 604.7 $ 4,103.2 $ 647.9 $ 3,884.1 $ 690.3
North America 2,244.0 155.9 2,293.4 110.4 2,522.0 213.9
Central & Eastern Europe 1,585.8 297.8 1,500.1 244.9 1,719.5 346.2
Western Europe, Middle East & Africa 1,462.1 176.5 1,277.8 84.2 1,351.7 121.0
Asia Pacific 752.4 93.4 677.3 61.6 679.3 87.7
China 229.0 (10.8) 353.4 20.1 350.9 17.7
Total from operations 10,862.8 1,317.5 10,205.2 1,169.1 10,507.5 1,476.8
Global and other – (244.4) – (163.5) – (152.3)
Total $10,862.8 $1,073.1 $10,205.2 $1,005.6 $10,507.5 $1,324.5
Total Assets
2010 2009 2008
Latin America $2,757.6 $2,414.9 $1,640.7
North America 1,478.0 831.5 899.0
Central & Eastern Europe 818.5 863.4 795.2
Western Europe, Middle East & Africa 782.7 611.0 519.4
Asia Pacific 451.4 362.0 328.3
China 179.2 255.7 254.6
Total assets of continuing operations 6,467.4 5,338.5 4,437.2
Total assets of discontinued operations – 123.1 130.2
Global and other 1,406.3 1,361.8 1,506.6
Total assets $7,873.7 $6,823.4 $6,074.0
Capital Expenditures
2010 2009 2008
Latin America $199.8 $160.6 $116.0
North America 19.2 39.3 111.9
Central & Eastern Europe 31.4 29.3 42.2
Western Europe, Middle East & Africa 23.2 33.9 41.6
Asia Pacific 15.3 8.7 20.7
China 3.6 7.0 14.2
Total from operations 292.5 278.8 346.6
Global and other 38.7 17.5 30.8
Total capital expenditures $331.2 $296.3 $377.4