Avon 2010 Annual Report Download - page 48
Download and view the complete annual report
Please find page 48 of the 2010 Avon annual report below. You can navigate through the pages in the report by either clicking on the pages listed below, or by using the keyword search tool below to find specific information within the annual report.-
 1
1 -
2
-
3
-
4
-
5
-
6
-
7
-
8
-
9
-
10
-
11
-
12
-
13
-
14
-
15
-
16
-
17
-
18
-
19
-
20
-
21
-
22
-
23
-
24
-
25
-
26
-
27
-
28
-
29
-
30
-
31
-
32
-
33
-
34
-
35
-
36
-
37
-
 38
38 -
 39
39 -
 40
40 -
 41
41 -
 42
42 -
 43
43 -
 44
44 -
 45
45 -
 46
46 -
 47
47 -
 48
48 -
 49
49 -
 50
50 -
 51
51 -
 52
52 -
 53
53 -
 54
54 -
 55
55 -
 56
56 -
 57
57 -
 58
58 -
59
-
60
-
61
-
62
-
63
-
64
-
65
-
66
-
67
-
68
-
69
-
70
-
71
-
72
-
73
-
74
-
75
-
76
-
77
-
78
-
79
-
80
-
81
-
82
-
83
-
84
-
85
-
86
-
87
-
88
-
89
-
90
-
91
-
92
-
93
-
94
-
95
-
96
-
97
-
98
-
99
-
100
-
101
-
102
-
103
-
104
-
105
-
106
-
107
-
108
-
109
-
110
-
111
-
112
-
113
-
114
 |
 |

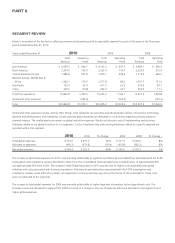
PART II
The Constant $ revenue increase in Russia for 2009 was primarily due to strong growth in Active Representatives. In late 2008, we
completed the roll-out of Sales Leadership and improved the discount structure we offered Representatives in Russia. The Constant $
revenue increase in Ukraine for 2009 was primarily due to growth in Active Representatives and a higher average order due to increased
pricing from inflation, partially offset by the negative impact of recent economic conditions.
During 2009, operating margin was negatively impacted by 1.8 points due to higher CTI restructuring compared to the prior year. On an
adjusted Non-GAAP basis, excluding CTI restructuring, the decrease in operating margin for 2009 as compared to 2008 was primarily driven
by the unfavorable impacts of foreign exchange transactions, which negatively impacted operating margin by an estimated 5 points, partially
offset by lower advertising costs in 2009 as compared to 2008 and the benefit of higher Constant $ revenues with fixed overhead expenses.
Adjusted Non-GAAP operating margin for 2009 was also negatively impacted by higher obsolescence expense in 2009, as the 2008 period
benefited from an adjustment to inventory obsolescence reserve due to changes in our estimates to our disposition plan of products reserved
for under PLS.
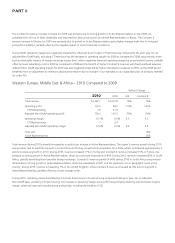
Western Europe, Middle East & Africa – 2010 Compared to 2009
%/Point Change
2010 2009 US$ Constant $
Total revenue $1,462.1 $1,277.8 14% 15%
Operating profit 176.5 84.2 110% 107%
CTI Restructuring 1.6 31.0
Adjusted Non-GAAP operating profit 178.1 115.2 55% 56%
Operating margin 12.1% 6.6% 5.5 5.5
CTI Restructuring .1 2.4
Adjusted Non-GAAP operating margin 12.2% 9.0% 3.2 3.2
Units sold 12%
Active Representatives 12%
Total revenue during 2010 primarily increased as a result of an increase in Active Representatives. The region’s revenue growth during 2010
was primarily due to significant growth in South Africa and Turkey, as well as the acquisition of Liz Earle, which contributed approximately 3
points to revenue growth in 2010. During 2010, revenue increased 17% in Turkey and Constant $ revenue increased 15% in Turkey, due
primarily to strong growth in Active Representatives, driven by continued investments in RVP. During 2010, revenue increased 82% in South
Africa, partially benefiting from favorable foreign exchange. Constant $ revenue growth of 64% during 2010 in South Africa was primarily
attributable to strong growth in Active Representatives, driven by investments in RVP, and the expansion of our geographic reach in the
country. During 2010, revenue increased by 1% in the United Kingdom, while Constant $ revenue increased by 3% due to a growth in
Active Representatives, partially offset by a lower average order.
During 2010, operating margin benefited by 2.3 points due to lower CTI restructuring compared to the prior year. On an Adjusted
Non-GAAP basis, excluding CTI restructuring, the increase in operating margin during 2010 was primarily driven by improvements in gross
margin, driven by improved manufacturing productivity, including the benefits of SSI.