Avon 2010 Annual Report Download - page 69
Download and view the complete annual report
Please find page 69 of the 2010 Avon annual report below. You can navigate through the pages in the report by either clicking on the pages listed below, or by using the keyword search tool below to find specific information within the annual report.-
 1
1 -
2
-
3
-
4
-
5
-
6
-
7
-
8
-
9
-
10
-
11
-
12
-
13
-
14
-
15
-
16
-
17
-
18
-
19
-
20
-
21
-
22
-
23
-
24
-
25
-
26
-
27
-
28
-
29
-
30
-
31
-
32
-
33
-
34
-
35
-
36
-
37
-
38
-
39
-
40
-
41
-
42
-
43
-
44
-
45
-
46
-
47
-
48
-
49
-
50
-
51
-
52
-
53
-
54
-
55
-
56
-
57
-
58
-
 59
59 -
 60
60 -
 61
61 -
 62
62 -
 63
63 -
 64
64 -
 65
65 -
 66
66 -
 67
67 -
 68
68 -
 69
69 -
 70
70 -
 71
71 -
 72
72 -
 73
73 -
 74
74 -
 75
75 -
 76
76 -
 77
77 -
 78
78 -
 79
79 -
80
-
81
-
82
-
83
-
84
-
85
-
86
-
87
-
88
-
89
-
90
-
91
-
92
-
93
-
94
-
95
-
96
-
97
-
98
-
99
-
100
-
101
-
102
-
103
-
104
-
105
-
106
-
107
-
108
-
109
-
110
-
111
-
112
-
113
-
114
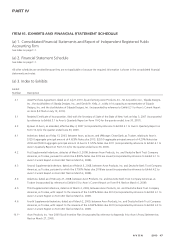
 |
 |

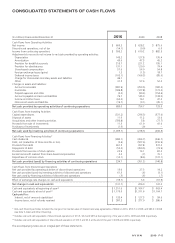
CONSOLIDATED STATEMENTS OF CASH FLOWS
(In millions) Years ended December 31 2010 2009 2008
Cash Flows from Operating Activities
Net income $ 609.3 $ 628.2 $ 875.6
Discontinued operations, net of tax (14.1) (9.0) 6.9
Income from continuing operations $ 595.2 $ 619.2 $ 882.5
Adjustments to reconcile net income to net cash provided by operating activities:
Depreciation 145.2 127.8 136.4
Amortization 49.6 47.5 45.2
Provision for doubtful accounts 215.7 221.2 195.1
Provision for obsolescence 131.1 120.0 79.4
Share-based compensation 57.6 54.9 54.8
Foreign exchange losses (gains) 1.3 (1.5) 18.7
Deferred income taxes (103.1) (166.3) (85.6)
Charge for Venezuelan monetary assets and liabilities 46.1 – –
Other 31.5 57.6 52.3
Changes in assets and liabilities:
Accounts receivable (281.9) (259.5) (182.4)
Inventories (189.8) (127.8) (172.2)
Prepaid expenses and other (3.3) (90.4) (154.6)
Accounts payable and accrued liabilities 76.7 145.0 (138.0)
Income and other taxes (63.2) 16.1 47.4
Noncurrent assets and liabilities (19.7) (9.1) (45.1)
Net cash provided by operating activities of continuing operations 689.0 754.7 733.9
Cash Flows from Investing Activities
Capital expenditures (331.2) (296.3) (377.4)
Disposal of assets 11.9 11.2 13.4
Acquisitions and other investing activities (785.8) 5.8 (77.7)
Proceeds from sale of investments 11.3 61.9 41.4
Purchases of investments (1.9) (.9) –
Net cash used by investing activities of continuing operations (1,095.7) (218.3) (400.3)
Cash Flows from Financing Activities*
Cash dividends (384.1) (364.7) (346.7)
Debt, net (maturities of three months or less) (3.6) (507.6) (216.9)
Proceeds from debt 661.5 957.8 572.3
Repayment of debt (53.2) (450.5) (73.9)
Proceeds from exercise of stock options 23.9 13.1 81.4
Excess tax benefit realized from share-based compensation 4.3 (.7) 15.1
Repurchase of common stock (14.1) (8.6) (172.1)
Net cash provided (used) by financing activities of continuing operations 234.7 (361.2) (140.8)
Cash Flows from Discontinued Operations
Net cash provided by operating activities of discontinued operations 13.0 27.3 14.2
Net cash provided (used) by investing activities of discontinued operations 61.3 (.6) (3.1)
Net cash used by financing activities of discontinued operations (.3) (.6) (.7)
Effect of exchange rate changes on cash and equivalents (33.7) 5.6 (61.9)
Net change in cash and equivalents (131.7) 206.9 141.3
Cash and equivalents at beginning of year(1) $ 1,311.6 $1,104.7 $ 963.4
Cash and equivalents at end of year(2) $ 1,179.9 $1,311.6 $1,104.7
Cash paid for:
Interest, net of amounts capitalized $ 133.4 $ 127.5 $ 99.6
Income taxes, net of refunds received $ 387.3 $ 377.9 $ 386.4
* Non-cash financing activities included the change in fair market value of interest rate swap agreements of $66.8 in 2010, $(55.7) in 2009, and $83.6 in 2008
(see Note 5, Debt and Other Financing).
(1) Includes cash and cash equivalent of discontinued operations of $13.5, $3.2 and $9.9 at the beginning of the year in 2010, 2009 and 2008 respectively.
(2) Includes cash and cash equivalents of discontinued operations of $13.5 and $3.2 at the end of the year in 2009 and 2008, respectively.
The accompanying notes are an integral part of these statements.
A V O N 2010 F-5