Avon 2010 Annual Report Download - page 43
Download and view the complete annual report
Please find page 43 of the 2010 Avon annual report below. You can navigate through the pages in the report by either clicking on the pages listed below, or by using the keyword search tool below to find specific information within the annual report.-
 1
1 -
2
-
3
-
4
-
5
-
6
-
7
-
8
-
9
-
10
-
11
-
12
-
13
-
14
-
15
-
16
-
17
-
18
-
19
-
20
-
21
-
22
-
23
-
24
-
25
-
26
-
27
-
28
-
29
-
30
-
31
-
32
-
 33
33 -
 34
34 -
 35
35 -
 36
36 -
 37
37 -
 38
38 -
 39
39 -
 40
40 -
 41
41 -
 42
42 -
 43
43 -
 44
44 -
 45
45 -
 46
46 -
 47
47 -
 48
48 -
 49
49 -
 50
50 -
 51
51 -
 52
52 -
 53
53 -
54
-
55
-
56
-
57
-
58
-
59
-
60
-
61
-
62
-
63
-
64
-
65
-
66
-
67
-
68
-
69
-
70
-
71
-
72
-
73
-
74
-
75
-
76
-
77
-
78
-
79
-
80
-
81
-
82
-
83
-
84
-
85
-
86
-
87
-
88
-
89
-
90
-
91
-
92
-
93
-
94
-
95
-
96
-
97
-
98
-
99
-
100
-
101
-
102
-
103
-
104
-
105
-
106
-
107
-
108
-
109
-
110
-
111
-
112
-
113
-
114
 |
 |

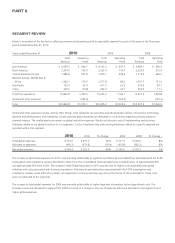
Latin America – 2010 Compared to 2009
%/Point Change
2010 2009 US$ Constant $
Total revenue $4,589.5 $4,103.2 12% 13%
Operating profit 604.7 647.9 (7)% 6%
CTI Restructuring 19.8 34.4
Venezuelan special items 81.0 –
Adjusted Non-GAAP operating profit 705.5 682.3 3% 4%
Operating margin 13.2% 15.8% (2.6) (1.0)
CTI Restructuring .4 .8
Venezuelan special items 1.8 –
Adjusted Non-GAAP operating margin 15.4% 16.6% (1.2) (1.4)
Units sold 5%
Active Representatives 8%
Total revenue during 2010 increased due to growth in Active Representatives, driven by continued investments in RVP, and a higher average
order. Revenue during 2010 grew 20% in Brazil and 15% in Mexico, with benefits from favorable foreign exchange, while the impact of
unfavorable foreign exchange drove a revenue decline of 27% in Venezuela during 2010. Additional information regarding our Venezuela
operations is discussed in more detail below. Constant $ revenue during 2010 benefited from continued growth in most markets,
particularly from growth of 8% in Brazil, 8% in Mexico and 47% in Venezuela.
Constant $ revenue growth in Mexico during 2010, was driven by an increase in Active Representatives, as well as an increase in average
order. Constant $ revenue growth for 2010, in Venezuela reflected a higher average order primarily due to increased prices, partially as a
result of inflation, and growth in Active Representatives.
Constant $ revenue growth during 2010 in Brazil was primarily driven by an increase in Active Representatives. Constant $ revenue growth
in 2010 in Brazil was pressured by service disruptions in the second half of the year and a decline in skincare sales. Brazil’s revenue grew
38% and 9% during the first half and second half of 2010, respectively, with constant $ growth rates of 13% in the first half and 4% in the
second half. Brazil’s performance in the second half of 2010 was primarily driven by service disruptions resulting in shorting of products. The
mid-year implementation of government mandated e-invoicing exacerbated our legacy order processing systems and capacity which have
also been pressured by a significant increase in order scale in recent years as Brazil’s growth during this period outpaced our expectations
and our planned infrastructure investments. These factors pressured the capacity of our legacy systems and were the primary cause of the
service disruptions.
Operating margin declined during 2010 in Latin America due to the negative impact of the devaluation of the Venezuelan currency in
conjunction with highly inflationary accounting as discussed further below. The decline in operating margin during 2010 caused by the
Venezuelan special items was partially offset by benefits of .4 points from lower CTI restructuring. On an Adjusted Non-GAAP basis,
excluding the Venezuelan special items and CTI restructuring, the decrease in operating margin in 2010 was primarily driven by higher
distribution costs, increased investment in RVP and advertising, partially offset by the benefit of favorable foreign exchange.
Effective January 1, 2010, we began to account for Venezuela as a highly inflationary economy. Effective January 11, 2010, the Venezuelan
government devalued its currency and moved to a two-tier exchange structure. The official exchange rate moved from 2.15 to 2.60 for
essential goods and to 4.30 for nonessential goods and services. Effective December 30, 2010, the Venezuelan government eliminated the
2.60 rate which had been available for the import of essential goods. Substantially all of the imports of our subsidiary in Venezuela (“Avon
Venezuela”) falls into the nonessential classification.
As a result of the change in the nonessentials official rate to 4.30 in conjunction with accounting for our operations in Venezuela under
highly inflationary accounting guidelines, during the first quarter of 2010, we recorded net charges of $46.1 in “Other expense, net” and
$12.7 in “income taxes”, for a total after-tax charge of $58.8, reflecting the write-down of monetary assets and liabilities and deferred tax
A V O N 2010 31