Avon 2010 Annual Report Download - page 30
Download and view the complete annual report
Please find page 30 of the 2010 Avon annual report below. You can navigate through the pages in the report by either clicking on the pages listed below, or by using the keyword search tool below to find specific information within the annual report.-
 1
1 -
2
-
3
-
4
-
5
-
6
-
7
-
8
-
9
-
10
-
11
-
12
-
13
-
14
-
15
-
16
-
17
-
18
-
19
-
 20
20 -
 21
21 -
 22
22 -
 23
23 -
 24
24 -
 25
25 -
 26
26 -
 27
27 -
 28
28 -
 29
29 -
 30
30 -
 31
31 -
 32
32 -
 33
33 -
 34
34 -
 35
35 -
 36
36 -
 37
37 -
 38
38 -
 39
39 -
 40
40 -
41
-
42
-
43
-
44
-
45
-
46
-
47
-
48
-
49
-
50
-
51
-
52
-
53
-
54
-
55
-
56
-
57
-
58
-
59
-
60
-
61
-
62
-
63
-
64
-
65
-
66
-
67
-
68
-
69
-
70
-
71
-
72
-
73
-
74
-
75
-
76
-
77
-
78
-
79
-
80
-
81
-
82
-
83
-
84
-
85
-
86
-
87
-
88
-
89
-
90
-
91
-
92
-
93
-
94
-
95
-
96
-
97
-
98
-
99
-
100
-
101
-
102
-
103
-
104
-
105
-
106
-
107
-
108
-
109
-
110
-
111
-
112
-
113
-
114
 |
 |

PART II
The Stock Performance Graph shall not be deemed to be “soliciting material” or to be “filed” with the Securities and Exchange Commission
or subject to the liabilities of Section 18 under the Securities Exchange Act of 1934. In addition, it shall not be deemed incorporated by
reference by any statement that incorporates this annual report on Form 10-K by reference into any filing under the Securities Act of 1933
or the Securities Exchange Act of 1934, except to the extent that we specifically incorporate this information by reference.
Issuer Purchases of Equity Securities
The following table provides information about our purchases of our common stock during the fourth quarter of 2010:
Total Number
of Shares
Purchased (1)
Average Price
Paid per Share
Total Number of Shares
Purchased as Part of
Publicly Announced
Programs (2)
Approximate Dollar
Value of Shares that
May Yet Be Purchased
Under the Program
10/1/10 – 10/31/10 34,389 $32.02 – $1,819,774,000
11/1/10 – 11/30/10 885 30.22 – 1,819,774,000
12/1/10 – 12/31/10 – – – 1,819,774,000
Total 35,274 31.97 –
(1) Consists of shares that were repurchased by us in connection with employee elections to use shares to pay withholding taxes upon the vesting of their
restricted stock units.
(2)There were no shares purchased during the fourth quarter of 2010 as part of our $2.0 billion share repurchase program, publicly announced on October 11,
2007. The program commenced on December 17, 2007, and is scheduled to expire on December 17, 2012.
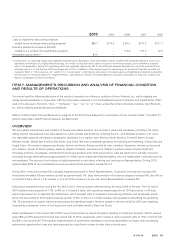
(Dollars in millions, except per share data)
ITEM 6. SELECTED FINANCIAL DATA
We derived the following selected financial data from our audited consolidated financial statements. The following data should be read in
conjunction with our MD&A and our Consolidated Financial Statements and related Notes.
2010 2009 2008 2007 (1) 2006
Income Data
Total revenue $10,862.8 $10,205.2 $10,507.5 $9,759.3 $8,571.0
Operating profit (2) 1,073.2 1,005.6 1,324.5 874.7 757.7
Income from continuing operations, net of tax 595.2 619.2 882.5 533.2 473.1
Diluted earnings per share from continuing operations $ 1.36 $ 1.43 $ 2.03 $ 1.21 $ 1.07
Cash dividends per share $ 0.88 $ 0.84 $ 0.80 $ 0.74 $ 0.70
Balance Sheet Data
Total assets $ 7,873.7 $ 6,823.4 $ 6,074.0 $5,716.2 $5,072.2
Debt maturing within one year 727.6 137.8 1,030.7 929.4 615.5
Long-term debt 2,408.6 2,307.2 1,456.0 1,167.7 1,170.5
Total debt 3,136.2 2,445.0 2,486.7 2,097.1 1,786.0
Total shareholders’ equity 1,672.6 1,312.6 712.3 749.8 827.4
(1) In 2007, we recorded a decrease of $18.3 to shareholders’ equity from the initial adoption of the provisions for recognizing and measuring tax positions
taken or expected to be taken in a tax return that affect amounts reported in the financial statements as required by the Income Taxes Topic of the FASB
Accounting Standards Codification (the “Codification”).
(2) A number of items, shown below, impact the comparability of our operating profit. See Latin America Segment review on page 31-33 and Note 15,
Restructuring Initiatives, to this 2010 Annual Report for more information on these items