Avon 2010 Annual Report Download - page 52
Download and view the complete annual report
Please find page 52 of the 2010 Avon annual report below. You can navigate through the pages in the report by either clicking on the pages listed below, or by using the keyword search tool below to find specific information within the annual report.-
 1
1 -
2
-
3
-
4
-
5
-
6
-
7
-
8
-
9
-
10
-
11
-
12
-
13
-
14
-
15
-
16
-
17
-
18
-
19
-
20
-
21
-
22
-
23
-
24
-
25
-
26
-
27
-
28
-
29
-
30
-
31
-
32
-
33
-
34
-
35
-
36
-
37
-
38
-
39
-
40
-
41
-
 42
42 -
 43
43 -
 44
44 -
 45
45 -
 46
46 -
 47
47 -
 48
48 -
 49
49 -
 50
50 -
 51
51 -
 52
52 -
 53
53 -
 54
54 -
 55
55 -
 56
56 -
 57
57 -
 58
58 -
 59
59 -
 60
60 -
 61
61 -
 62
62 -
63
-
64
-
65
-
66
-
67
-
68
-
69
-
70
-
71
-
72
-
73
-
74
-
75
-
76
-
77
-
78
-
79
-
80
-
81
-
82
-
83
-
84
-
85
-
86
-
87
-
88
-
89
-
90
-
91
-
92
-
93
-
94
-
95
-
96
-
97
-
98
-
99
-
100
-
101
-
102
-
103
-
104
-
105
-
106
-
107
-
108
-
109
-
110
-
111
-
112
-
113
-
114
 |
 |

PART II
In July 2010, Avon completed the purchase of substantially all the assets and liabilities of Silpada for approximately $650 in cash. Pursuant to
the terms of the agreement, we may be required to pay additional consideration in 2015 if Silpada’s North America business achieves
specific earnings target. The acquisition was funded with cash and commercial paper borrowings. Refer to Note 17, Goodwill and Intangible
Assets, to our 2010 Annual Report for more details.
Any issuances of equity securities or convertible securities could have a dilutive effect on the ownership interest of our current shareholders
and may adversely impact earnings per share in future periods.
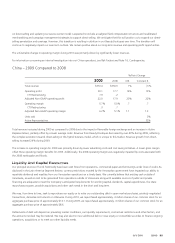
Our liquidity could also be impacted by dividends, capital expenditures and acquisitions. At any given time, we may be in discussions and
negotiations with potential acquisition candidates. Acquisitions may be accretive or dilutive and by their nature involve numerous risks and
uncertainties. See our Cautionary Statement for purposes of the “Safe Harbor” Statement under the Private Securities Litigation Reform
Act of 1995.
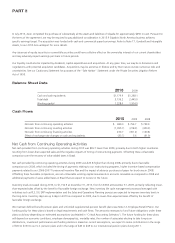
Balance Sheet Data
2010 2009
Cash and cash equivalents $1,179.9 $1,298.1
Total debt 3,136.2 2,445.0
Working capital 1,228.0 1,914.5
Cash Flows
2010 2009 2008
Net cash from continuing operating activities $ 689.0 $ 754.7 $ 733.9
Net cash from continuing investing activities (1,095.7) (218.3) (400.3)
Net cash from continuing financing activities 234.7 (361.2) (140.8)
Effect of exchange rate changes on cash and equivalents (33.7) 5.6 (61.9)
Net Cash from Continuing Operating Activities
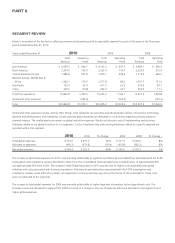
Net cash provided from continuing operating activities during 2010 was $65.7 lower than 2009, primarily due to both higher inventories
resulting from lower-than-expected sales and the negative impacts of timing of restructuring payments. Offsetting these unfavorable
comparisons are the recovery of value added taxes in Brazil.
Net cash provided by continuing operating activities during 2009 was $20.8 higher than during 2008, primarily due to favorable
comparisons to 2008, which included the timing of payments relating to our restructuring programs, higher incentive based compensation
payments related to our 2006-2007 Turnaround Incentive Plan and the impact of advance purchases of paper for brochures in 2008.
Offsetting these favorable comparisons, are net unfavorable working capital movements in accounts receivable as compared to 2008 and
additional payments of value added taxes in Brazil that we expect to recover in the future.
Inventory levels increased during 2010, to $1,152.9 at December 31, 2010, from $1,049.8 at December 31, 2009, primarily reflecting lower-
than-expected sales offset by the benefit of favorable foreign exchange. New inventory life cycle management processes leveraged with
initiatives such as PLS, SSI, ERP implementation and the Sales and Operations Planning process are expected to improve inventory levels in
the long-term. Inventory days are up 4 days in 2010 as compared to 2009, due to lower-than-expected sales offset by the benefit of
favorable foreign exchange.
We maintain defined benefit pension plans and unfunded supplemental pension benefit plans (see Note 12, Employee Benefit Plans). Our
funding policy for these plans is based on legal requirements and cash flows. The amounts necessary to fund future obligations under these
plans could vary depending on estimated assumptions (as detailed in “Critical Accounting Estimates”). The future funding for these plans
will depend on economic conditions, employee demographics, mortality rates, the number of associates electing to take lump-sum
distributions, investment performance and funding decisions. Based on current assumptions, we expect to make contributions in the range
of $90 to $100 to our U.S. pension plans and in the range of $40 to $45 to our international pension plans during 2011.