Avon 2010 Annual Report Download - page 88
Download and view the complete annual report
Please find page 88 of the 2010 Avon annual report below. You can navigate through the pages in the report by either clicking on the pages listed below, or by using the keyword search tool below to find specific information within the annual report.-
 1
1 -
2
-
3
-
4
-
5
-
6
-
7
-
8
-
9
-
10
-
11
-
12
-
13
-
14
-
15
-
16
-
17
-
18
-
19
-
20
-
21
-
22
-
23
-
24
-
25
-
26
-
27
-
28
-
29
-
30
-
31
-
32
-
33
-
34
-
35
-
36
-
37
-
38
-
39
-
40
-
41
-
42
-
43
-
44
-
45
-
46
-
47
-
48
-
49
-
50
-
51
-
52
-
53
-
54
-
55
-
56
-
57
-
58
-
59
-
60
-
61
-
62
-
63
-
64
-
65
-
66
-
67
-
68
-
69
-
70
-
71
-
72
-
73
-
74
-
75
-
76
-
77
-
 78
78 -
 79
79 -
 80
80 -
 81
81 -
 82
82 -
 83
83 -
 84
84 -
 85
85 -
 86
86 -
 87
87 -
 88
88 -
 89
89 -
 90
90 -
 91
91 -
 92
92 -
 93
93 -
 94
94 -
 95
95 -
 96
96 -
 97
97 -
 98
98 -
99
-
100
-
101
-
102
-
103
-
104
-
105
-
106
-
107
-
108
-
109
-
110
-
111
-
112
-
113
-
114
 |
 |

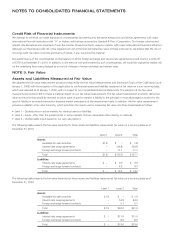
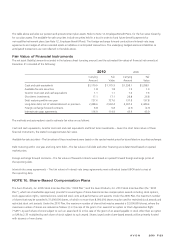
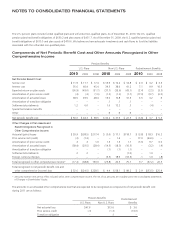
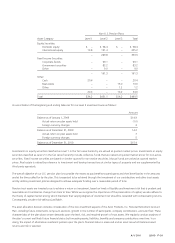
NOTES TO CONSOLIDATED FINANCIAL STATEMENTS
We have issued stock options, restricted stock, restricted stock units and stock appreciation rights under the 2005 Plan and the 2010 Plan.
Stock option awards are granted with an exercise price equal to the closing market price of our stock at the date of grant. Those option
awards generally vest in thirds over the three-year period following each option grant date and have ten-year contractual terms. Restricted
stock or restricted stock units generally vest after three years.
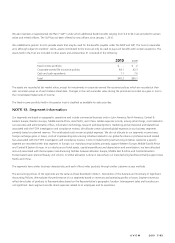
For the years ended December 31:
2010 2009 2008
Compensation cost for stock options, restricted stock, restricted stock units,
and stock appreciation rights $57.6 $54.9 $54.8
Total income tax benefit recognized for share-based arrangements 18.7 18.5 18.8
All of the compensation cost for stock options, restricted stock, restricted stock units, and stock appreciation rights for 2010, 2009, and
2008 was recorded in selling, general and administrative expenses. For the years ended December 31, 2010 and 2009, we have determined
that we have a pool of windfall tax benefits.
Stock Options
The fair value of each option award is estimated on the date of grant using a Black-Scholes-Merton option pricing model with the following
weighted-average assumptions for options granted during the years ended December 31:
2010 2009 2008
Risk-free rate(1) 1.9% 1.6% 2.3%
Expected term(2) 4 years 4 years 4 years
Expected volatility(3) 38% 35% 28%
Expected dividends(4) 3.0% 4.0% 2.0%
(1) The risk-free rate was based upon the rate on a zero coupon U.S. Treasury bill, for periods within the contractual life of the option, in effect at the
time of grant.
(2) The expected term of the option was based on historical employee exercise behavior, the vesting terms of the respective option and a contractual life
of ten years.
(3) Expected volatility was based on the weekly historical volatility of our stock price, over a period similar to the expected life of the option.
(4) Assumed the current cash dividends of $.22 during 2010, $.21 during 2009 and $.20 during 2008 per share each quarter on our common stock for options
granted during those years.
The weighted-average grant-date fair values per share of options granted were $7.91 during 2010, $3.18 during 2009 and $8.04
during 2008.
A summary of stock options as of December 31, 2010, and changes during 2010, is as follows:
Shares
(in 000’s)
Weighted-
Average
Exercise
Price
Weighted-
Average
Contractual
Term
Aggregate
Intrinsic
Value
Outstanding at January 1, 2010 28,484 $30.56
Granted 3,316 31.57
Exercised (1,202) 19.71
Forfeited (360) 22.97
Expired (583) 37.16
Outstanding at December 31, 2010 29,655 $31.07 5.7 $93.2
Exercisable at December 31, 2010 20,082 $33.50 4.4 $35.5