Avon 2010 Annual Report Download - page 53
Download and view the complete annual report
Please find page 53 of the 2010 Avon annual report below. You can navigate through the pages in the report by either clicking on the pages listed below, or by using the keyword search tool below to find specific information within the annual report.-
 1
1 -
2
-
3
-
4
-
5
-
6
-
7
-
8
-
9
-
10
-
11
-
12
-
13
-
14
-
15
-
16
-
17
-
18
-
19
-
20
-
21
-
22
-
23
-
24
-
25
-
26
-
27
-
28
-
29
-
30
-
31
-
32
-
33
-
34
-
35
-
36
-
37
-
38
-
39
-
40
-
41
-
42
-
 43
43 -
 44
44 -
 45
45 -
 46
46 -
 47
47 -
 48
48 -
 49
49 -
 50
50 -
 51
51 -
 52
52 -
 53
53 -
 54
54 -
 55
55 -
 56
56 -
 57
57 -
 58
58 -
 59
59 -
 60
60 -
 61
61 -
 62
62 -
 63
63 -
64
-
65
-
66
-
67
-
68
-
69
-
70
-
71
-
72
-
73
-
74
-
75
-
76
-
77
-
78
-
79
-
80
-
81
-
82
-
83
-
84
-
85
-
86
-
87
-
88
-
89
-
90
-
91
-
92
-
93
-
94
-
95
-
96
-
97
-
98
-
99
-
100
-
101
-
102
-
103
-
104
-
105
-
106
-
107
-
108
-
109
-
110
-
111
-
112
-
113
-
114
 |
 |

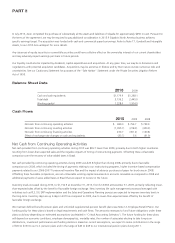
Net Cash from Continuing Investing Activities
Net cash used by continuing investing activities during 2010 was $877.4 higher than during 2009, primarily due to the acquisition of Silpada
and Liz Earle. In addition during the first half of 2009, we redeemed certain corporate-owned life insurance policies. Net cash used by
investing activities during 2009 was $182.0 lower than 2008, primarily due to the redemption of certain corporate-owned life insurance
policies in 2009 and lower capital expenditures.
Capital expenditures during 2010 were $331.2 compared with $296.3 in 2009 due to higher information technology expenditure in Latin
America. Capital expenditures during 2009 were $296.3 compared with $377.4 in 2008. This decrease resulted from our efforts to preserve
capital. Capital expenditures in 2011 are currently expected to be approximately $300 to $315 and will be funded by cash from operations.
These expenditures will include investments for capacity expansion, modernization of existing facilities, continued construction of new
distribution facilities in Latin America and information systems.
Net Cash from Continuing Financing Activities
Net cash provided by continuing financing activities of $234.7 during 2010 compared favorably to cash used by continuing financing
activities of $361.2 during 2009 primarily due to the issuance of debt in 2010 to partially finance the Silpada acquisition.
Net cash used by financing activities of $361.2 during 2009, compared unfavorably to cash used by financing activities of $140.8 during
2008. During 2009, we repaid $958.1 of commercial paper and other debt as compared to $290.8 during 2008. In 2009, we received
proceeds from the $850 debt issuance during March 2009 as compared to a $500 debt issuance during 2008. Additionally, during 2009 we
repurchased $8.6 of common stock as compared to $172.1 in 2008.
We purchased approximately .4 million shares of our common stock for $14.1 during 2010, as compared to .4 million shares for $8.6 during
2009 and 4.6 million shares for $172.1 during 2008, under our previously announced share repurchase programs and through acquisition of
stock from employees in connection with tax payments upon vesting of restricted stock units. In October 2007, the Board of Directors
authorized the repurchase of $2,000.0 of our common stock over a five-year period, which began in December 2007.
We increased our quarterly dividend payments to $.22 per share in 2010 from $.21 per share in 2009. In February 2011, our Board
approved an increase in the quarterly dividend to $.23 per share.
Debt and Contractual Financial Obligations and Commitments
At December 31, 2010, our debt and contractual financial obligations and commitments by due dates were as follows:
2011 2012 2013 2014 2015
2016 and
Beyond Total
Short-term debt $ 500.0 $ – $ – $ – $ – $ – $ 500.0
Long-term debt – – 375.0 500.0 142.0 1,243.0 2,260.0
Capital lease obligations 13.5 15.9 6.7 4.3 5.3 35.2 80.9
Total debt 513.5 15.9 381.7 504.3 147.3 1,278.2 2,840.9
Debt-related interest 117.3 115.8 101.8 74.0 68.8 67.8 545.5
Total debt-related 630.8 131.7 483.5 578.3 216.1 1,346.0 3,386.4
Operating leases 103.5 83.6 72.9 61.7 56.6 164.5 542.8
Purchase obligations 223.4 88.4 62.9 51.0 50.3 14.6 490.6
Benefit obligations (1) 125.8 11.8 9.5 9.2 7.6 44.1 208.0
Total debt and contractual financial
obligations and commitments (2) $1,083.5 $315.5 $628.8 $700.2 $330.6 $1,569.2 $4,627.8
(1) Amounts represent expected future benefit payments for our unfunded pension and postretirement benefit plans, as well as expected contributions for 2011
to our funded pension benefit plans. We are not able to estimate our contributions to our funded pension plans beyond 2011.
(2) The amount of debt and contractual financial obligations and commitments excludes amounts due under derivative transactions. The table also excludes
information on recurring purchases of inventory as these purchase orders are non-binding, are generally consistent from year to year, and are short-term in
nature. The table does not include any reserves for income taxes because we are unable to reasonably predict the ultimate amount or timing of settlementof
our reserves for income taxes. At December 31, 2010, our reserves for income taxes, including interest and penalties, totaled $97.8.
A V O N 2010 41