Avon 2010 Annual Report Download - page 89
Download and view the complete annual report
Please find page 89 of the 2010 Avon annual report below. You can navigate through the pages in the report by either clicking on the pages listed below, or by using the keyword search tool below to find specific information within the annual report.-
 1
1 -
2
-
3
-
4
-
5
-
6
-
7
-
8
-
9
-
10
-
11
-
12
-
13
-
14
-
15
-
16
-
17
-
18
-
19
-
20
-
21
-
22
-
23
-
24
-
25
-
26
-
27
-
28
-
29
-
30
-
31
-
32
-
33
-
34
-
35
-
36
-
37
-
38
-
39
-
40
-
41
-
42
-
43
-
44
-
45
-
46
-
47
-
48
-
49
-
50
-
51
-
52
-
53
-
54
-
55
-
56
-
57
-
58
-
59
-
60
-
61
-
62
-
63
-
64
-
65
-
66
-
67
-
68
-
69
-
70
-
71
-
72
-
73
-
74
-
75
-
76
-
77
-
78
-
 79
79 -
 80
80 -
 81
81 -
 82
82 -
 83
83 -
 84
84 -
 85
85 -
 86
86 -
 87
87 -
 88
88 -
 89
89 -
 90
90 -
 91
91 -
 92
92 -
 93
93 -
 94
94 -
 95
95 -
 96
96 -
 97
97 -
 98
98 -
 99
99 -
100
-
101
-
102
-
103
-
104
-
105
-
106
-
107
-
108
-
109
-
110
-
111
-
112
-
113
-
114
 |
 |

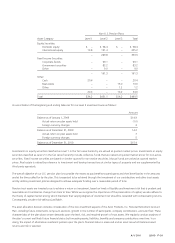
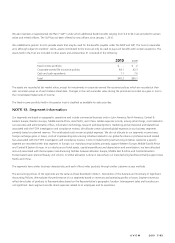
At December 31, 2010, there was approximately $15.3 of unrecognized compensation cost related to stock options outstanding. That cost
is expected to be recognized over a weighted-average period of 1.3 years. We recognize expense on stock options using a graded vesting
method, which recognizes the associated expense based on the timing of option vesting dates.
Cash proceeds, tax benefits, and intrinsic value related to total stock options exercised during 2010, 2009 and 2008, were as follows:
2010 2009 2008
Cash proceeds from stock options exercised $23.9 $13.1 $81.4
Tax benefit realized for stock options exercised 3.3 .9 12.2
Intrinsic value of stock options exercised 14.6 5.0 41.5
Restricted Stock and Restricted Stock Units
The fair value of restricted stock and restricted stock units granted was determined based on the closing price of our common stock on the
date of grant.
A summary of restricted stock and restricted stock units at December 31, 2010, and changes during 2010, is as follows:
Restricted
Stock
And Units
(in 000’s)
Weighted-
Average
Grant-Date
Fair Value
Nonvested at January 1, 2010 3,437 $29.68
Granted 947 31.41
Vested (1,267) 32.54
Forfeited (165) 23.52
Nonvested at December 31, 2010 2,952 $26.36
The total fair value of restricted stock and restricted stock units that vested during 2010 was $37.2, based upon market prices on the vesting
dates. As of December 31, 2010, there was approximately $29.1 of unrecognized compensation cost related to restricted stock and
restricted stock unit compensation arrangements. That cost is expected to be recognized over a weighted-average period of 1.9 years.
NOTE 11. Stock Repurchase Program
In October 2007, our Board of Directors approved a five-year $2,000.0 share repurchase program (“$2.0 billion program”) which began in
December 2007. We have repurchased approximately 4.8 million shares for $180.2 under the $2.0 billion program through December 31, 2010.
NOTE 12. Employee Benefit Plans
Savings Plan
We offer a qualified defined contribution plan for U.S.-based employees, the Avon Personal Savings Account Plan (the “PSA”), which allows
eligible participants to contribute up to 25% of eligible compensation through payroll deductions. We match employee contributions dollar
for dollar up to the first 3% of eligible compensation and fifty cents for each dollar contributed from 4% to 6% of eligible compensation.
We made matching contributions in cash to the PSA of $12.5 in 2010, $12.1 in 2009 and $13.0 in 2008, which were then used by the PSA
to purchase our shares in the open market.
Defined Benefit Pension and Postretirement Plans
Avon and certain subsidiaries have contributory and noncontributory retirement plans for substantially all employees of those subsidiaries.
Benefits under these plans are generally based on an employee’s years of service and average compensation near retirement. Plans are
funded based on legal requirements and cash flow.
A V O N 2010 F-25