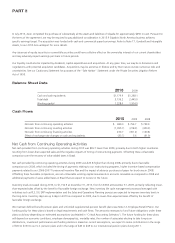
Avon 2010 Annual Report Download - page 51
Download and view the complete annual report
Please find page 51 of the 2010 Avon annual report below. You can navigate through the pages in the report by either clicking on the pages listed below, or by using the keyword search tool below to find specific information within the annual report.-
 1
1 -
2
-
3
-
4
-
5
-
6
-
7
-
8
-
9
-
10
-
11
-
12
-
13
-
14
-
15
-
16
-
17
-
18
-
19
-
20
-
21
-
22
-
23
-
24
-
25
-
26
-
27
-
28
-
29
-
30
-
31
-
32
-
33
-
34
-
35
-
36
-
37
-
38
-
39
-
40
-
 41
41 -
 42
42 -
 43
43 -
 44
44 -
 45
45 -
 46
46 -
 47
47 -
 48
48 -
 49
49 -
 50
50 -
 51
51 -
 52
52 -
 53
53 -
 54
54 -
 55
55 -
 56
56 -
 57
57 -
 58
58 -
 59
59 -
 60
60 -
 61
61 -
62
-
63
-
64
-
65
-
66
-
67
-
68
-
69
-
70
-
71
-
72
-
73
-
74
-
75
-
76
-
77
-
78
-
79
-
80
-
81
-
82
-
83
-
84
-
85
-
86
-
87
-
88
-
89
-
90
-
91
-
92
-
93
-
94
-
95
-
96
-
97
-
98
-
99
-
100
-
101
-
102
-
103
-
104
-
105
-
106
-
107
-
108
-
109
-
110
-
111
-
112
-
113
-
114
 |
 |

on direct-selling and updating our service center model is expected to include a realigned field compensation structure and recalibrated
merchandising and campaign management strategies to support direct-selling. We anticipate that this will position us to expand our direct-
selling penetration and coverage. However, this transition is resulting in attrition in our Beauty Boutiques over time. The transition will
continue to negatively impact our near-term outlook. We remain positive about our long-term revenue and operating profit opportunities.
The unfavorable change in operating margin during 2010 was primarily driven by significantly lower revenues.
For information concerning an internal investigation into our China operations, see Risk Factors and Note 16, Contingencies.
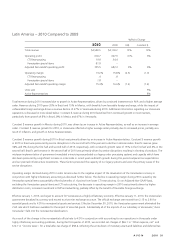
China – 2009 Compared to 2008
%/Point Change
2009 2008 US$ Constant $
Total revenue $353.4 $350.9 1% (1)%
Operating profit 20.1 17.7 14% 12%
CTI Restructuring 1.9 .2
Adjusted Non-GAAP operating profit 22.0 17.9 23% 22%
Operating margin 5.7% 5.0% .7 .7
CTI Restructuring .5 .1
Adjusted Non-GAAP operating margin 6.2% 5.1% 1.1 1.2
Units sold 3%
Active Representatives 32%
Total revenue increased during 2009 as compared to 2008 due to the impact of favorable foreign exchange and an increase in Active
Representatives, partially offset by a lower average order. Revenue from Beauty Boutiques decreased by over 40% during 2009, reflecting
the complex evolution towards direct-selling in this hybrid business model, which is unique to this market. Revenue growth from direct-
selling increased 24% during 2009.
The increase in operating margin for 2009 was primarily driven by lower advertising costs and cost saving initiatives. A lower gross margin
offset these operating margin benefits for 2009. Additionally, the 2008 operating margin was negatively impacted by costs associated with
the 2008 earthquake and floods.
Liquidity And Capital Resources
Our principal sources of funds historically have been cash flows from operations, commercial paper and borrowings under lines of credit. As
disclosed in the Latin America Segment Review, currency restrictions enacted by the Venezuelan government have impacted our ability to
repatriate dividends and royalties from our Venezuelan operations on a timely basis. We currently believe that existing cash outside of
Venezuela, as well as cash to be generated from operations outside of Venezuela along with available sources of public and private
financing are adequate to meet the Company’s anticipated requirements for working capital, dividends, capital expenditures, the share
repurchase program, possible acquisitions and other cash needs in the short and long term.
We may, from time to time, seek to repurchase our equity or to retire our outstanding debt in open market purchases, privately negotiated
transactions, derivative instruments or otherwise. During 2010, we repurchased approximately .4 million shares of our common stock for an
aggregate purchase price of approximately $14.1. During 2009, we repurchased approximately .4 million shares of our common stock for an
aggregate purchase price of approximately $8.6.
Retirements of debt will depend on prevailing market conditions, our liquidity requirements, contractual restrictions and other factors, and
the amounts involved may be material. We may also elect to incur additional debt or issue equity or convertible securities to finance ongoing
operations, acquisitions or to meet our other liquidity needs.
A V O N 2010 39