Avon 2010 Annual Report Download - page 46
Download and view the complete annual report
Please find page 46 of the 2010 Avon annual report below. You can navigate through the pages in the report by either clicking on the pages listed below, or by using the keyword search tool below to find specific information within the annual report.-
 1
1 -
2
-
3
-
4
-
5
-
6
-
7
-
8
-
9
-
10
-
11
-
12
-
13
-
14
-
15
-
16
-
17
-
18
-
19
-
20
-
21
-
22
-
23
-
24
-
25
-
26
-
27
-
28
-
29
-
30
-
31
-
32
-
33
-
34
-
35
-
 36
36 -
 37
37 -
 38
38 -
 39
39 -
 40
40 -
 41
41 -
 42
42 -
 43
43 -
 44
44 -
 45
45 -
 46
46 -
 47
47 -
 48
48 -
 49
49 -
 50
50 -
 51
51 -
 52
52 -
 53
53 -
 54
54 -
 55
55 -
 56
56 -
57
-
58
-
59
-
60
-
61
-
62
-
63
-
64
-
65
-
66
-
67
-
68
-
69
-
70
-
71
-
72
-
73
-
74
-
75
-
76
-
77
-
78
-
79
-
80
-
81
-
82
-
83
-
84
-
85
-
86
-
87
-
88
-
89
-
90
-
91
-
92
-
93
-
94
-
95
-
96
-
97
-
98
-
99
-
100
-
101
-
102
-
103
-
104
-
105
-
106
-
107
-
108
-
109
-
110
-
111
-
112
-
113
-
114
 |
 |

PART II
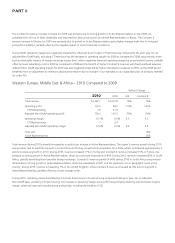
The total revenue decline during 2010 was due to a decline in Active Representatives and a lower average order received from
Representatives. The decline in Active Representatives for 2010 was largely due to a decline in additions compared with last year’s record
recruiting. This resulted in strong growth in Active Representatives during 2009 causing an unfavorable comparison in 2010. Sales of
non-Beauty products decreased 1% during 2010, with Silpada offsetting the decline by 10 points. Sales of Beauty products decreased 4%
during 2010, partly due to weakness in the beauty market.
The increase in North America operating margin and Adjusted Non-GAAP operating margin during 2010 was primarily driven by
improvements in gross margin caused by favorable pricing and mix and manufacturing productivity gains and the inclusion of Silpada
results, which benefited operating margin by 1.2 points during 2010, despite approximately $7 of amortization of intangible assets. These
operating margin benefits were negatively impacted by lower revenues which were not able to offset overhead expenses, despite cost
saving initiatives. The costs associated with completing the Silpada acquisition were recorded in global expenses and were not allocated to
the North America segment. Included within the Silpada results was an operating margin benefit of .7 points due to a change in the fair
value of the contingent consideration recorded in connection with the Silpada acquisition, primarily due to a decrease in estimates of the
ultimate earnout.
We expect our results to continue to be pressured, as we focus on our recovery plan and transitioning our North America business, which
includes optimizing our product portfolio and enhancing field fundamentals.
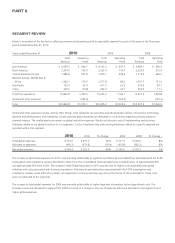
North America – 2009 Compared to 2008
%/Point Change
2009 2008 US$ Constant $
Total revenue $2,293.4 $2,522.0 (9)% (9)%
Operating profit 110.4 213.9 (48)% (48)%
CTI Restructuring 40.5 11.1
Adjusted Non-GAAP operating profit 150.9 225.0 (33)% (32)%
Operating margin 4.8% 8.5% (3.7) (3.6)
CTI Restructuring 1.8 .4
Adjusted Non-GAAP operating margin 6.6% 8.9% (2.3) (2.3)
Units sold (7)%
Active Representatives 3%
Total revenue for 2009 was negatively impacted by the continued recessionary pressure, as a lower average order received from
Representatives more than offset an increase in Active Representatives. Average order was particularly challenged in our non-beauty
categories during 2009 as compared to 2008. Sales of non-Beauty products declined 13% in 2009, consistent with the general retail
environment. Sales of Beauty products declined 6% in 2009.
The growth in Active Representatives during 2009 reflected our ongoing recruiting and training efforts.
During 2009, operating margin was negatively impacted by 1.4 points due to higher CTI restructuring compared to the same period in the
prior year. On an Adjusted Non-GAAP basis, excluding CTI restructuring, the decline in operating margin during 2009 was due to lower
revenues with fixed overhead expense and higher obsolescence expense during 2009.