Avon 2010 Annual Report Download - page 42
Download and view the complete annual report
Please find page 42 of the 2010 Avon annual report below. You can navigate through the pages in the report by either clicking on the pages listed below, or by using the keyword search tool below to find specific information within the annual report.-
 1
1 -
2
-
3
-
4
-
5
-
6
-
7
-
8
-
9
-
10
-
11
-
12
-
13
-
14
-
15
-
16
-
17
-
18
-
19
-
20
-
21
-
22
-
23
-
24
-
25
-
26
-
27
-
28
-
29
-
30
-
31
-
 32
32 -
 33
33 -
 34
34 -
 35
35 -
 36
36 -
 37
37 -
 38
38 -
 39
39 -
 40
40 -
 41
41 -
 42
42 -
 43
43 -
 44
44 -
 45
45 -
 46
46 -
 47
47 -
 48
48 -
 49
49 -
 50
50 -
 51
51 -
 52
52 -
53
-
54
-
55
-
56
-
57
-
58
-
59
-
60
-
61
-
62
-
63
-
64
-
65
-
66
-
67
-
68
-
69
-
70
-
71
-
72
-
73
-
74
-
75
-
76
-
77
-
78
-
79
-
80
-
81
-
82
-
83
-
84
-
85
-
86
-
87
-
88
-
89
-
90
-
91
-
92
-
93
-
94
-
95
-
96
-
97
-
98
-
99
-
100
-
101
-
102
-
103
-
104
-
105
-
106
-
107
-
108
-
109
-
110
-
111
-
112
-
113
-
114
 |
 |

PART II
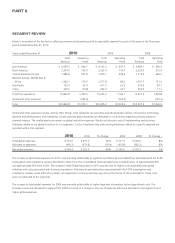
SEGMENT REVIEW
Below is an analysis of the key factors affecting revenue and operating profit by reportable segment for each of the years in the three-year
period ended December 31, 2010.
Years ended December 31 2010 2009 2008
Total
Revenue
Operating
Profit
Total
Revenue
Operating
Profit
Total
Revenue
Operating
Profit
Latin America $ 4,589.5 $ 604.7 $ 4,103.2 $ 647.9 $ 3,884.1 $ 690.3
North America 2,244.0 155.9 2,293.4 110.4 2,522.0 213.9
Central & Eastern Europe 1,585.8 297.8 1,500.1 244.9 1,719.5 346.2
Western Europe, Middle East &
Africa 1,462.1 176.5 1,277.8 84.2 1,351.7 121.0
Asia Pacific 752.4 93.4 677.3 61.6 679.3 87.7
China 229.0 (10.8) 353.4 20.1 350.9 17.7
Total from operations 10,862.8 1,320.5 10,205.2 1,169.1 10,507.5 1,476.8
Global and other expenses – (244.4) – (163.5) – (152.3)
Total $10,862.8 $1,073.1 $10,205.2 $1,005.6 $10,507.5 $1,324.5
Global and other expenses include, among other things, costs related to our executive and administrative offices, information technology,
research and development, and marketing. Certain planned global expenses are allocated to our business segments primarily based on
planned revenue. The unallocated costs remain as global and other expenses. We do not allocate costs of implementing restructuring
initiatives related to our global functions to our segments. Costs of implementing restructuring initiatives related to a specific segment are
recorded within that segment.
2010 2009 % Change 2009 2008 % Change
Total global expenses $ 713.6 $ 577.3 24% $ 577.3 $ 534.5 8%
Allocated to segments (469.2) (413.8) (13)% (413.8) (382.2) 8%
Net global expenses $ 244.4 $ 163.5 49% $ 163.5 $ 152.3 7%
The increase in Net Global expenses for 2010, was primarily attributable to significant professional and related fees associated with the FCPA
investigation and compliance reviews described in Note 16 to the consolidated financial statements included herein of approximately $95
(up approximately $59 from 2009). The increase in Net Global expenses for 2010 was also due to higher costs associated with global
initiatives and costs associated with business acquisitions. Professional and related fees associated with the FCPA investigation and
compliance reviews, while difficult to predict, are expected to continue and may vary during the course of this investigation. These costs
were not allocated to the segments.
The increase in total global expenses for 2009 was primarily attributable to higher legal and information technology related costs. The
increase in amounts allocated to segments for 2009 is a result of a change in the mix of expenses which are allocated to the segments and
higher global expenses.