Avon 2010 Annual Report Download - page 50
Download and view the complete annual report
Please find page 50 of the 2010 Avon annual report below. You can navigate through the pages in the report by either clicking on the pages listed below, or by using the keyword search tool below to find specific information within the annual report.-
 1
1 -
2
-
3
-
4
-
5
-
6
-
7
-
8
-
9
-
10
-
11
-
12
-
13
-
14
-
15
-
16
-
17
-
18
-
19
-
20
-
21
-
22
-
23
-
24
-
25
-
26
-
27
-
28
-
29
-
30
-
31
-
32
-
33
-
34
-
35
-
36
-
37
-
38
-
39
-
 40
40 -
 41
41 -
 42
42 -
 43
43 -
 44
44 -
 45
45 -
 46
46 -
 47
47 -
 48
48 -
 49
49 -
 50
50 -
 51
51 -
 52
52 -
 53
53 -
 54
54 -
 55
55 -
 56
56 -
 57
57 -
 58
58 -
 59
59 -
 60
60 -
61
-
62
-
63
-
64
-
65
-
66
-
67
-
68
-
69
-
70
-
71
-
72
-
73
-
74
-
75
-
76
-
77
-
78
-
79
-
80
-
81
-
82
-
83
-
84
-
85
-
86
-
87
-
88
-
89
-
90
-
91
-
92
-
93
-
94
-
95
-
96
-
97
-
98
-
99
-
100
-
101
-
102
-
103
-
104
-
105
-
106
-
107
-
108
-
109
-
110
-
111
-
112
-
113
-
114
 |
 |

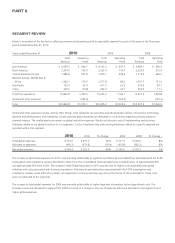
PART II
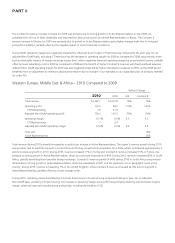
During 2010, operating margin benefited by 2.7 points due to lower CTI restructuring compared to the prior year. On an Adjusted
Non-GAAP basis, excluding CTI restructuring, operating margin during 2010 benefited from improved gross margin, which benefited from
lower product costs and favorable foreign exchange, which benefited gross margin by approximately 1 point, partially offset by an increased
investment in RVP.
Asia Pacific – 2009 Compared to 2008
%/Point Change
2009 2008 US$ Constant $
Total revenue $677.3 $679.3 –% 6%
Operating profit 61.6 87.7 (30)% (24)%
CTI Restructuring 18.5 (0.6)
Adjusted Non-GAAP operating profit 80.1 87.2 (8)% (2)%
Operating margin 9.1% 12.9% (3.8) (3.8)
CTI Restructuring 2.7 (.1)
Adjusted Non-GAAP operating margin 11.8% 12.8% (1.0) (1.0)
Units sold 4%
Active Representatives 7%
The region’s results for 2009 and 2008 exclude the results of Japan, which was classified as a discontinued operation beginning in the fourth
quarter of 2010.
Total revenue was flat for 2009, impacted by unfavorable foreign exchange. Constant $ revenue increased for 2009 as a result of growth in
Active Representatives, offset by a lower average order. Revenue in the Philippines increased 6%, while Constant $ revenue in the
Philippines increased by 14%, driven by growth in Active Representatives, supported by RVP initiatives.
Operating margin for 2009 as compared to 2008 was negatively impacted by 2.8 points due to higher CTI restructuring. On an Adjusted
Non-GAAP basis, excluding CTI restructuring, the decrease in operating margin for 2009 was primarily driven by unfavorable foreign
exchange, including the impacts of foreign exchange transactions as well as translation, which negatively impacted operating margin by an
estimated 2 points. Partially offsetting these items were the benefits of growth derived from higher margin markets.
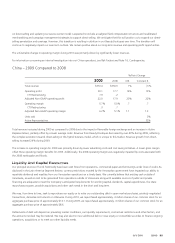
China – 2010 Compared to 2009
%/Point Change
2010 2009 US$ Constant $
Total revenue $229.0 $353.4 (35)% (36)%
Operating (loss) profit (10.8) 20.1 (154)% (154)%
CTI Restructuring (.1) 1.9
Adjusted Non-GAAP operating (loss) profit (10.9) 22.0 (150)% (150)%
Operating margin (4.7)% 5.7% (10.4) (10.6)
CTI Restructuring – .5
Adjusted Non-GAAP operating margin (4.8)% 6.2% (11.0) (11.1)
Units sold (38)%
Active Representatives (39)%
Total revenue during 2010 decreased due to significant revenue declines in both direct-selling and Beauty Boutiques. The fundamental
challenges in our complex hybrid business model, including conflicting needs of retail and direct-selling, impacted both businesses, resulting
in a 39% reduction in Active Representatives. Our continued transition away from our complex hybrid business model to one which focuses