Avon 2010 Annual Report Download - page 31
Download and view the complete annual report
Please find page 31 of the 2010 Avon annual report below. You can navigate through the pages in the report by either clicking on the pages listed below, or by using the keyword search tool below to find specific information within the annual report.-
 1
1 -
2
-
3
-
4
-
5
-
6
-
7
-
8
-
9
-
10
-
11
-
12
-
13
-
14
-
15
-
16
-
17
-
18
-
19
-
20
-
 21
21 -
 22
22 -
 23
23 -
 24
24 -
 25
25 -
 26
26 -
 27
27 -
 28
28 -
 29
29 -
 30
30 -
 31
31 -
 32
32 -
 33
33 -
 34
34 -
 35
35 -
 36
36 -
 37
37 -
 38
38 -
 39
39 -
 40
40 -
 41
41 -
42
-
43
-
44
-
45
-
46
-
47
-
48
-
49
-
50
-
51
-
52
-
53
-
54
-
55
-
56
-
57
-
58
-
59
-
60
-
61
-
62
-
63
-
64
-
65
-
66
-
67
-
68
-
69
-
70
-
71
-
72
-
73
-
74
-
75
-
76
-
77
-
78
-
79
-
80
-
81
-
82
-
83
-
84
-
85
-
86
-
87
-
88
-
89
-
90
-
91
-
92
-
93
-
94
-
95
-
96
-
97
-
98
-
99
-
100
-
101
-
102
-
103
-
104
-
105
-
106
-
107
-
108
-
109
-
110
-
111
-
112
-
113
-
114
 |
 |

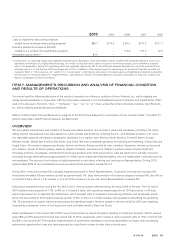
2010 2009 2008 2007 2006
Costs to implement restructuring initiatives
related to our multi-year restructuring programs $80.7 $170.9 $ 59.3 $157.5 $217.1
Inventory obsolescence expense (benefit)
related to our product line simplification program – – (13.0) 167.3 72.6
Venezuelan special items (3) 81.0 – – – –
(3) During 2010, our operating margin was negatively impacted by the devaluation of the Venezuelan currency coupled with a required change to account for
operations in Venezuela on a highly inflationary basis. As a result of using the historic dollar cost basis of nonmonetary assets, such as inventory, acquired
prior to the devaluation, during 2010 operating profit was negatively impacted by $81 for the difference between the historical cost at the previous official
exchange rate of 2.15 and the new official exchange rate of 4.30. In addition to the negative impact to operating profit, during 2010 we also recorded net
charges of $46.1 in “Other expense, net” and $12.7 in “income taxes”, reflecting the write-down of monetary assets and liabilities and deferred tax benefits.
See discussion of Venezuela within the “Segment Review - Latin America” section of this Management’s Discussion and Analysis of Financial Condition and
Results of Operations for more information.
ITEM 7. MANAGEMENT’S DISCUSSION AND ANALYSIS OF FINANCIAL CONDITION
AND RESULTS OF OPERATIONS
You should read the following discussion of the results of operations and financial condition of Avon Products, Inc. and its majority and
wholly owned subsidiaries in conjunction with the information contained in the Consolidated Financial Statements and related Notes. When
used in this discussion, the terms “Avon,” “Company,” “we,” “our” or “us” mean, unless the context otherwise indicates, Avon Products,
Inc. and its majority and wholly owned subsidiaries.
Refer to the Non-GAAP Financial Measures on page 23 of this 2010 Annual Report for a description of how Constant dollar (“Constant $”)
growth rates (a Non-GAAP financial measure) are determined.
OVERVIEW
We are a global manufacturer and marketer of beauty and related products. Our business is conducted worldwide, primarily in the direct-
selling channel. We presently have sales operations in 64 countries and territories, including the U.S., and distribute products in 41 more.
Our reportable segments are based on geographic operations in six regions: Latin America; North America; Central & Eastern Europe;
Western Europe, Middle East & Africa; Asia Pacific; and China. We have centralized operations for Global Brand Marketing, Global Sales and
Supply Chain. Our product categories are Beauty, Fashion and Home. Beauty consists of color cosmetics, fragrances, skincare and personal
care. Fashion consists of fashion jewelry, watches, apparel, footwear, accessories and children’s products. Home consists of gift and
decorative products, housewares, entertainment and leisure products and nutritional products. Sales are made to the ultimate consumer
principally through direct-selling by approximately 6.5 million active independent Representatives, who are independent contractors and not
our employees. The success of our business is highly dependent on recruiting, retaining and servicing our Representatives. During 2010,
approximately 83% of our consolidated revenue was derived from operations outside the U.S.
During 2010, revenues increased 6%, favorably impacted by growth in Active Representatives. Constant $ revenues also increased 6%.
Acquisitions benefited full-year revenue growth by approximately 1%. Sales from products in the Beauty category increased 6%, also 6% on
a Constant $ basis, due to a 1% increase in units and 5% increase in net per unit. Active Representatives increased 4%.
Following strong performance during the first half of 2010, revenue growth softened during the second half of the year. The first half of
2010 realized revenue growth of 11%, or 8% on a Constant $ basis, with operating margin expansion of 150 basis points, or 90 basis
points improvement on an adjusted Non-GAAP basis, which excludes costs to implement restructuring initiatives and Venezuelan special
items. The second half of 2010 realized revenue growth of 3%, or 6% on a Constant $ basis, with acquisitions benefiting the growth by
3%. This slowdown of organic revenue growth pressured operating margins. Revenue growth in the second half of 2010 was negatively
impacted by a slowdown in two of our largest and most profitable markets, Brazil and Russia.
Brazil’s performance in the second half of 2010 was primarily driven by service disruptions resulting in shorting of products. Brazil’s revenue
grew 38% and 9% during the first half and second half of 2010, respectively, with Constant $ revenue growth rates of 13% in the first half
and 4% in the second half. The mid-year implementation of government mandated e-invoicing exacerbated our legacy order processing
systems and capacity which have also been pressured by a significant increase in order scale in recent years.
A V O N 2010 19