Avon 2010 Annual Report Download - page 35
Download and view the complete annual report
Please find page 35 of the 2010 Avon annual report below. You can navigate through the pages in the report by either clicking on the pages listed below, or by using the keyword search tool below to find specific information within the annual report.-
 1
1 -
2
-
3
-
4
-
5
-
6
-
7
-
8
-
9
-
10
-
11
-
12
-
13
-
14
-
15
-
16
-
17
-
18
-
19
-
20
-
21
-
22
-
23
-
24
-
 25
25 -
 26
26 -
 27
27 -
 28
28 -
 29
29 -
 30
30 -
 31
31 -
 32
32 -
 33
33 -
 34
34 -
 35
35 -
 36
36 -
 37
37 -
 38
38 -
 39
39 -
 40
40 -
 41
41 -
 42
42 -
 43
43 -
 44
44 -
 45
45 -
46
-
47
-
48
-
49
-
50
-
51
-
52
-
53
-
54
-
55
-
56
-
57
-
58
-
59
-
60
-
61
-
62
-
63
-
64
-
65
-
66
-
67
-
68
-
69
-
70
-
71
-
72
-
73
-
74
-
75
-
76
-
77
-
78
-
79
-
80
-
81
-
82
-
83
-
84
-
85
-
86
-
87
-
88
-
89
-
90
-
91
-
92
-
93
-
94
-
95
-
96
-
97
-
98
-
99
-
100
-
101
-
102
-
103
-
104
-
105
-
106
-
107
-
108
-
109
-
110
-
111
-
112
-
113
-
114
 |
 |

increased efficiencies, streamlining transaction-related services, including selective outsourcing, and reorganizing certain other functions. We
expect to record total restructuring charges and other costs to implement these restructuring initiatives in the range of approximately $300
to $310 before taxes under the 2009 Restructuring Program. Through December 31, 2010, we have recorded total costs to implement, net
of adjustments, of $228.3 ($77.5 in 2010, and $150.8 in 2009) for actions associated with our restructuring initiatives, primarily for
employee-related costs, including severance, pension and other termination benefits, and professional service fees related to these initiatives.
Actions implemented under these restructuring initiatives resulted in savings of approximately $15 in 2009. We achieved savings of
approximately $80 in 2010. We are targeting annualized savings under the 2009 Restructuring Program of approximately $200 upon full
implementation by 2012-2013.
See Note 15, Restructuring Initiatives, on pages F-36 through F-40 of our 2010 Annual Report.
On an overall basis, we estimate that we have realized approximately $500 of benefits from PLS and SSI and $430 of savings from our two
restructuring programs since the inception of our multi-year turnaround plan in 2005. These savings have been offset by approximately $650
of investments in advertising and RVP.
New Accounting Standards
Information relating to new accounting standards is included in Note 2, New Accounting Standards, of our consolidated financial statements
contained in this 2010 Annual Report.
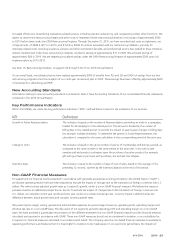
Key Performance Indicators
Within this MD&A, we utilize the key performance indicators (“KPIs”) defined below to assist in the evaluation of our business.
KPI Definition
Growth in Active Representatives This indicator is based on the number of Representatives submitting an order in a campaign,
totaled for all campaigns in the related period. This amount is divided by the number of
billing days in the related period, to exclude the impact of year-to-year changes in billing days
(for example, holiday schedules). To determine the growth in Active Representatives, this
calculation is compared to the same calculation in the corresponding period of the prior year.
Change in Units This indicator is based on the gross number of pieces of merchandise sold during a period, as
compared to the same number in the same period of the prior year. Units sold include
samples sold and product contingent upon the purchase of another product (for example,
gift with purchase or purchase with purchase), but exclude free samples.
Inventory Days This indicator is equal to the number of days of cost of sales, based on the average of the
preceding 12 months, covered by the inventory balance at the end of the period.
Non-GAAP Financial Measures
To supplement our financial results presented in accordance with generally accepted accounting principles in the United States (“GAAP”),
we disclose operating results that have been adjusted to exclude the impact of changes due to the translation of foreign currencies into U.S.
dollars. We refer to these adjusted growth rates as Constant $ growth, which is a non-GAAP financial measure. We believe this measure
provides investors an additional perspective on trends. To exclude the impact of changes due to the translation of foreign currencies into
U.S. dollars, we calculate current year results and prior year results at a constant exchange rate. Currency impact is determined as the
difference between actual growth rates and constant currency growth rates.
We present gross margin, selling, general and administrative expenses as a percentage of revenue, operating profit, operating margin and
effective tax rate on a non-GAAP basis. The discussion of our segments presents operating profit and operating margin on a non-GAAP
basis. We have provided a quantitative reconciliation of the difference between the non-GAAP financial measure and the financial measure
calculated and reported in accordance with GAAP. These non-GAAP measures should not be considered in isolation, or as a substitute for,
or superior to, financial measures calculated in accordance with GAAP. The Company uses the non-GAAP financial measures to evaluate its
operating performance and believes that it is meaningful for investors to be made aware of, on a period to period basis, the impacts of
A V O N 2010 23