Avon 2010 Annual Report Download - page 18
Download and view the complete annual report
Please find page 18 of the 2010 Avon annual report below. You can navigate through the pages in the report by either clicking on the pages listed below, or by using the keyword search tool below to find specific information within the annual report.-
 1
1 -
2
-
3
-
4
-
5
-
6
-
7
-
 8
8 -
 9
9 -
 10
10 -
 11
11 -
 12
12 -
 13
13 -
 14
14 -
 15
15 -
 16
16 -
 17
17 -
 18
18 -
 19
19 -
 20
20 -
 21
21 -
 22
22 -
 23
23 -
 24
24 -
 25
25 -
 26
26 -
 27
27 -
 28
28 -
29
-
30
-
31
-
32
-
33
-
34
-
35
-
36
-
37
-
38
-
39
-
40
-
41
-
42
-
43
-
44
-
45
-
46
-
47
-
48
-
49
-
50
-
51
-
52
-
53
-
54
-
55
-
56
-
57
-
58
-
59
-
60
-
61
-
62
-
63
-
64
-
65
-
66
-
67
-
68
-
69
-
70
-
71
-
72
-
73
-
74
-
75
-
76
-
77
-
78
-
79
-
80
-
81
-
82
-
83
-
84
-
85
-
86
-
87
-
88
-
89
-
90
-
91
-
92
-
93
-
94
-
95
-
96
-
97
-
98
-
99
-
100
-
101
-
102
-
103
-
104
-
105
-
106
-
107
-
108
-
109
-
110
-
111
-
112
-
113
-
114
 |
 |

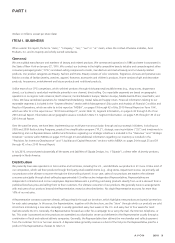
PART I
Manufacturing
We manufacture and package almost all of our Beauty products. Raw materials, consisting chiefly of essential oils, chemicals, containers and
packaging components, are purchased for our Beauty products from various suppliers. Almost all of our Fashion and Home products are
purchased from various suppliers. Additionally, we design the brochures that are used by the Representatives to sell our products. The loss of
any one supplier would not have a material impact on our ability to source raw materials for our Beauty products or source products for our
Fashion and Home categories or paper for the brochures.
Packages, consisting of containers and packaging components, are designed by our staff of artists and designers. The design and
development of new Beauty products are affected by the cost and availability of materials such as glass, plastics and chemicals. We
believe that we can continue to obtain sufficient raw materials and supplies to manufacture and produce our Beauty products for the
foreseeable future.
As further described in the “Overview” and “Strategic Initiatives” sections within MD&A on pages 19 through 23, we continue to
implement the principles of SSI to reduce direct and indirect costs of materials, goods and services. Under this initiative, we continue to shift
our purchasing strategy from a local, commodity-oriented approach towards a globally-coordinated effort.
We also continue to implement an enterprise resource planning (“ERP”) system on a worldwide basis, which is expected to improve the
efficiency of our supply chain and financial transaction processes. The implementation is expected to continue in phases over the next several
years. We have completed implementation in certain significant markets.
See Item 2, Properties, for additional information regarding the location of our principal manufacturing facilities.
Product Categories
Each of our three product categories account for 10% or more of consolidated net sales. The following is the percentage of net sales by
product category for the years ended December 31:
2010 2009 2008
Beauty 71% 72% 72%
Fashion 19% 18% 18%
Home 10% 10% 10%
Trademarks and Patents
Our business is not materially dependent on the existence of third-party patent, trademark or other third-party intellectual property rights,
and we are not a party to any ongoing material licenses, franchises or concessions. We do seek to protect our key proprietary technologies
by aggressively pursuing comprehensive patent coverage in major markets. We protect our Avon name and other major proprietary
trademarks through registration of these trademarks in the markets where we sell our products, monitoring the markets for infringement of
such trademarks by others, and by taking appropriate steps to stop any infringing activities.
Seasonal Nature of Business
Our sales and earnings have a marked seasonal pattern characteristic of many companies selling Beauty, gift and decorative products,
apparel, and fashion jewelry. Holiday sales cause a sales peak in the fourth quarter of the year; however, the sales volume of holiday gift
items is, by its nature, difficult to forecast. Fourth quarter revenue and operating data was as follows:
2010 2009
Fourth quarter revenues as a % of total revenue 29% 31%
Fourth quarter operating profit as a % of total operating profit 33% 41%
The fourth quarter operating profit comparison between 2010 and 2009 was impacted by higher costs to implement our restructuring
initiatives in 2010 compared to 2009. The fourth quarter of 2010 included costs to implement our restructuring initiatives of $58.3, whereas
the fourth quarter of 2009 included $33.7 of costs to implement our restructuring initiatives.