Audi 2008 Annual Report Download - page 255
Download and view the complete annual report
Please find page 255 of the 2008 Audi annual report below. You can navigate through the pages in the report by either clicking on the pages listed below, or by using the keyword search tool below to find specific information within the annual report.-
 1
1 -
2
-
3
-
4
-
5
-
6
-
7
-
8
-
9
-
10
-
11
-
12
-
13
-
14
-
15
-
16
-
17
-
18
-
19
-
20
-
21
-
22
-
23
-
24
-
25
-
26
-
27
-
28
-
29
-
30
-
31
-
32
-
33
-
34
-
35
-
36
-
37
-
38
-
39
-
40
-
41
-
42
-
43
-
44
-
45
-
46
-
47
-
48
-
49
-
50
-
51
-
52
-
53
-
54
-
55
-
56
-
57
-
58
-
59
-
60
-
61
-
62
-
63
-
64
-
65
-
66
-
67
-
68
-
69
-
70
-
71
-
72
-
73
-
74
-
75
-
76
-
77
-
78
-
79
-
80
-
81
-
82
-
83
-
84
-
85
-
86
-
87
-
88
-
89
-
90
-
91
-
92
-
93
-
94
-
95
-
96
-
97
-
98
-
99
-
100
-
101
-
102
-
103
-
104
-
105
-
106
-
107
-
108
-
109
-
110
-
111
-
112
-
113
-
114
-
115
-
116
-
117
-
118
-
119
-
120
-
121
-
122
-
123
-
124
-
125
-
126
-
127
-
128
-
129
-
130
-
131
-
132
-
133
-
134
-
135
-
136
-
137
-
138
-
139
-
140
-
141
-
142
-
143
-
144
-
145
-
146
-
147
-
148
-
149
-
150
-
151
-
152
-
153
-
154
-
155
-
156
-
157
-
158
-
159
-
160
-
161
-
162
-
163
-
164
-
165
-
166
-
167
-
168
-
169
-
170
-
171
-
172
-
173
-
174
-
175
-
176
-
177
-
178
-
179
-
180
-
181
-
182
-
183
-
184
-
185
-
186
-
187
-
188
-
189
-
190
-
191
-
192
-
193
-
194
-
195
-
196
-
197
-
198
-
199
-
200
-
201
-
202
-
203
-
204
-
205
-
206
-
207
-
208
-
209
-
210
-
211
-
212
-
213
-
214
-
215
-
216
-
217
-
218
-
219
-
220
-
221
-
222
-
223
-
224
-
225
-
226
-
227
-
228
-
229
-
230
-
231
-
232
-
233
-
234
-
235
-
236
-
237
-
238
-
239
-
240
-
241
-
242
-
243
-
244
-
 245
245 -
 246
246 -
 247
247 -
 248
248 -
 249
249 -
 250
250 -
 251
251 -
 252
252 -
 253
253 -
 254
254 -
 255
255 -
 256
256 -
 257
257 -
 258
258 -
 259
259 -
 260
260 -
 261
261
 |
 |

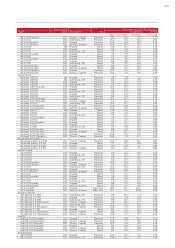
10-Year Overview
1999 2000 2001 2002 20031) 20041) 20051) 2006 2007 2008
HGB IFRS IFRS IFRS IFRS IFRS IFRS IFRS IFRS IFRS
Production Cars 626,059 650,850 727,033 735,913 761,582 784,972 811,522 926,180 980,880 1,029,041
Engines 1,266,896 1,187,666 1,225,448 1,284,488 1,342,883 1,485,536 1,695,045 1,895,695 1,915,633 1,901,760
Vehicle sales
Audi Group Cars 634,973 919,621 991,444 995,531 1,003,791 971,832 1,045,114 1,135,554 1,200,701 1,223,506
Audi brand Cars 634,708 653,404 726,134 742,128 769,893 779,441 829,109 905,188 964,151 1,003,469
Germany Cars 257,642 239,644 254,866 243,650 237,786 235,092 247,125 257,792 254,014 258,111
Outside Germany Cars 377,066 413,760 471,268 498,478 532,107 544,349 581,984 647,396 710,137 745,358
Outside Germany Percent 59.4 63.3 64.9 67.2 69.1 69.8 70.2 71.5 73.7 74.3
Market share, Germany Percent 6.8 6.9 7.5 7.4 7.4 7.2 7.4 7.6 7.9 8.1
Lamborghini brand Cars 265 296 297 424 1,305 1,592 1,600 2,087 2,406 2,430
Other Volkswagen Group brands Cars — 265,921 265,013 252,979 232,593 190,799 214,405 228,279 234,144 217,607
Employees Average 45,800 49,396 51,141 51,198 52,689 53,144 52,412 52,297 53,347 57,533
From the Income Statement
Revenue EUR million 15,146 19,952 22,032 22,603 23,406 24,506 26,591 31,142 33,617 34,196
Cost of materials EUR million 10,155 14,539 15,860 16,726 17,163 17,676 19,139 21,627 23,092 23,430
Personnel costs EUR million 2,291 2,542 2,660 2,739 2,938 3,072 3,136 3,440 3,406 3,709
Personnel costs per employee EUR 50,022 51,456 52,018 53,496 55,763 57,798 59,834 65,771 63,846 64,467
Depreciation and amortization EUR million 945 1,179 1,412 1,614 1,833 1,852 1,930 2,515 2,287 1,908
Profi t before tax EUR million 839 971 1,286 1,219 1,101 1,143 1,310 1,946 2,915 3,177
Profi t after tax EUR million 324 725 747 752 811 871 824 1,343 1,692 2,207
Added value EUR million 3,198 3,590 3,892 4,000 4,287 4,585 4,801 6,156 6,634 7,072
From the Balance Sheet
Non-current assets EUR million 3,679 7,039 7,685 8,308 8,588 8,970 8,597 8,285 8,325 9,537
Current assets EUR million 3,024 3,219 3,437 4,342 5,475 5,934 7,515 10,625 14,253 16,519
Equity EUR million 1,441 3,749 4,222 4,761 5,487 5,828 6,104 7,265 8,355 10,328
Liabilities EUR million 5,262 6,509 6,900 7,889 8,576 9,076 10,008 11,645 14,223 15,728
Balance sheet total EUR million 6,703 10,258 11,122 12,650 14,063 14,904 16,112 18,910 22,578 26,056
From the Cash Flow Statement
Cash fl ow from operating activities EUR million 1,163 2,058 2,393 2,440 2,786 2,690 3,252 4,428 4,876 4,338
Investing activities2) EUR million —3) 2,502 2,028 2,305 2,015 2,041 1,670 1,890 2,084 2,412
Net liquidity (Dec. 31) EUR million —3) 827 1,093 877 1,530 2,033 3,391 5,720 7,860 9,292
Financial ratios
Return on sales before tax Percent 5.5 4.9 5.8 5.4 4.7 4.7 4.9 6.2 8.7 9.3
Equity ratio Percent 21.5 36.5 38.0 37.6 39.0 39.1 37.9 38.4 37.0 39.6
Audi share
Share price (year-end price)4) EUR 61.20 59.59 160.00 191.00 225.00 220.15 308.00 540.00 625.00 466.49
Compensatory payment EUR 0.77 1.20 1.30 1.30 1.05 1.05 1.15 1.25 1.80 X5)
1) Financial data adjusted to take account of amendments to IAS 19 and 38
2) Not including securities, fi xed deposits and loans
3) HGB value not shown owing to lack of comparability
4) Year-end price on Munich Stock Exchange
5) In accordance with the resolution to be passed by the Annual General Meeting of Volkswagen AG on April 23, 2009