Audi 2008 Annual Report Download - page 231
Download and view the complete annual report
Please find page 231 of the 2008 Audi annual report below. You can navigate through the pages in the report by either clicking on the pages listed below, or by using the keyword search tool below to find specific information within the annual report.-
 1
1 -
2
-
3
-
4
-
5
-
6
-
7
-
8
-
9
-
10
-
11
-
12
-
13
-
14
-
15
-
16
-
17
-
18
-
19
-
20
-
21
-
22
-
23
-
24
-
25
-
26
-
27
-
28
-
29
-
30
-
31
-
32
-
33
-
34
-
35
-
36
-
37
-
38
-
39
-
40
-
41
-
42
-
43
-
44
-
45
-
46
-
47
-
48
-
49
-
50
-
51
-
52
-
53
-
54
-
55
-
56
-
57
-
58
-
59
-
60
-
61
-
62
-
63
-
64
-
65
-
66
-
67
-
68
-
69
-
70
-
71
-
72
-
73
-
74
-
75
-
76
-
77
-
78
-
79
-
80
-
81
-
82
-
83
-
84
-
85
-
86
-
87
-
88
-
89
-
90
-
91
-
92
-
93
-
94
-
95
-
96
-
97
-
98
-
99
-
100
-
101
-
102
-
103
-
104
-
105
-
106
-
107
-
108
-
109
-
110
-
111
-
112
-
113
-
114
-
115
-
116
-
117
-
118
-
119
-
120
-
121
-
122
-
123
-
124
-
125
-
126
-
127
-
128
-
129
-
130
-
131
-
132
-
133
-
134
-
135
-
136
-
137
-
138
-
139
-
140
-
141
-
142
-
143
-
144
-
145
-
146
-
147
-
148
-
149
-
150
-
151
-
152
-
153
-
154
-
155
-
156
-
157
-
158
-
159
-
160
-
161
-
162
-
163
-
164
-
165
-
166
-
167
-
168
-
169
-
170
-
171
-
172
-
173
-
174
-
175
-
176
-
177
-
178
-
179
-
180
-
181
-
182
-
183
-
184
-
185
-
186
-
187
-
188
-
189
-
190
-
191
-
192
-
193
-
194
-
195
-
196
-
197
-
198
-
199
-
200
-
201
-
202
-
203
-
204
-
205
-
206
-
207
-
208
-
209
-
210
-
211
-
212
-
213
-
214
-
215
-
216
-
217
-
218
-
219
-
220
-
 221
221 -
 222
222 -
 223
223 -
 224
224 -
 225
225 -
 226
226 -
 227
227 -
 228
228 -
 229
229 -
 230
230 -
 231
231 -
 232
232 -
 233
233 -
 234
234 -
 235
235 -
 236
236 -
 237
237 -
 238
238 -
 239
239 -
 240
240 -
 241
241 -
242
-
243
-
244
-
245
-
246
-
247
-
248
-
249
-
250
-
251
-
252
-
253
-
254
-
255
-
256
-
257
-
258
-
259
-
260
-
261
 |
 |

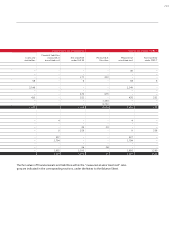
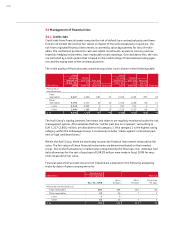
212
EUR million
Carrying amount as per
balance sheet as of
Dec. 31, 2007
Measured at fair value
through profit or loss Available for sale
ASSETS
Non-current
Other long-term investments 49 – 49
Other receivables and assets 286 – –
of which from positive fair values of derivative financial instruments 222 45 –
miscellaneous other receivables and assets 64 – –
Current
Trade receivables 2,149 – –
Other receivables and assets 1,365 – –
of which from positive fair values of derivative financial instruments 679 7 –
miscellaneous other receivables and assets 686 – –
Securities 1,333 – 1,333
Cash and cash equivalents 6,740 – 6,740
Total financial assets 11,922 52 8,122
LIABILITIES AND SHAREHOLDERS’ EQUITY
Non-current
Financial liabilities 4– –
Other liabilities 288 – –
of which from negative fair values of derivative financial instruments 23 – –
miscellaneous other liabilities 265 – –
Current
Financial liabilities 527 – –
Trade payables 2,794 – –
Other liabilities 3,013 – –
of which from negative fair values of derivative financial instruments 28 2 –
miscellaneous other liabilities 2,985 – –
Total financial liabilities 6,626 2 –