Audi 2008 Annual Report Download - page 208
Download and view the complete annual report
Please find page 208 of the 2008 Audi annual report below. You can navigate through the pages in the report by either clicking on the pages listed below, or by using the keyword search tool below to find specific information within the annual report.-
 1
1 -
2
-
3
-
4
-
5
-
6
-
7
-
8
-
9
-
10
-
11
-
12
-
13
-
14
-
15
-
16
-
17
-
18
-
19
-
20
-
21
-
22
-
23
-
24
-
25
-
26
-
27
-
28
-
29
-
30
-
31
-
32
-
33
-
34
-
35
-
36
-
37
-
38
-
39
-
40
-
41
-
42
-
43
-
44
-
45
-
46
-
47
-
48
-
49
-
50
-
51
-
52
-
53
-
54
-
55
-
56
-
57
-
58
-
59
-
60
-
61
-
62
-
63
-
64
-
65
-
66
-
67
-
68
-
69
-
70
-
71
-
72
-
73
-
74
-
75
-
76
-
77
-
78
-
79
-
80
-
81
-
82
-
83
-
84
-
85
-
86
-
87
-
88
-
89
-
90
-
91
-
92
-
93
-
94
-
95
-
96
-
97
-
98
-
99
-
100
-
101
-
102
-
103
-
104
-
105
-
106
-
107
-
108
-
109
-
110
-
111
-
112
-
113
-
114
-
115
-
116
-
117
-
118
-
119
-
120
-
121
-
122
-
123
-
124
-
125
-
126
-
127
-
128
-
129
-
130
-
131
-
132
-
133
-
134
-
135
-
136
-
137
-
138
-
139
-
140
-
141
-
142
-
143
-
144
-
145
-
146
-
147
-
148
-
149
-
150
-
151
-
152
-
153
-
154
-
155
-
156
-
157
-
158
-
159
-
160
-
161
-
162
-
163
-
164
-
165
-
166
-
167
-
168
-
169
-
170
-
171
-
172
-
173
-
174
-
175
-
176
-
177
-
178
-
179
-
180
-
181
-
182
-
183
-
184
-
185
-
186
-
187
-
188
-
189
-
190
-
191
-
192
-
193
-
194
-
195
-
196
-
197
-
 198
198 -
 199
199 -
 200
200 -
 201
201 -
 202
202 -
 203
203 -
 204
204 -
 205
205 -
 206
206 -
 207
207 -
 208
208 -
 209
209 -
 210
210 -
 211
211 -
 212
212 -
 213
213 -
 214
214 -
 215
215 -
 216
216 -
 217
217 -
 218
218 -
219
-
220
-
221
-
222
-
223
-
224
-
225
-
226
-
227
-
228
-
229
-
230
-
231
-
232
-
233
-
234
-
235
-
236
-
237
-
238
-
239
-
240
-
241
-
242
-
243
-
244
-
245
-
246
-
247
-
248
-
249
-
250
-
251
-
252
-
253
-
254
-
255
-
256
-
257
-
258
-
259
-
260
-
261
 |
 |
189
Consolidated Financial
Statements
170 Income Statement
171 Balance Sheet
172 Cash Flow Statement
173 Statement of Changes in Equity
Notes to the Consolidated
Financial Statements
174 Development of
fixed assets 2008
176 Development of
fixed assets 2007
178 General information
183 Recognition and
measurement principles
183 Recognition of income
and expenses
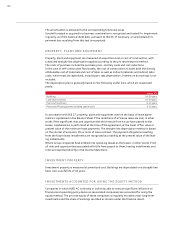
183 Intangible assets
184 Property, plant
and equipment
184 Investment property
184 Investments accounted for
using the equity method
185 Impairment tests
185 Financial instruments
187 Other receivables and
financial assets
187 Deferred tax
187 Inventories
188 Securities, cash and
cash equivalents
188 Provisions for pensions
188 Other provisions
188 Management’s estimates
and assessments
189 Notes to the Income
Statement
196 Notes to the Balance Sheet
209 Additional disclosures
227 Events occurring subsequent
to the balance sheet date
228 Statement of Interests
held by the Audi Group
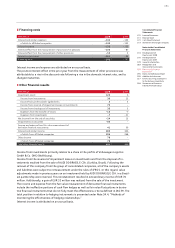
NOTES TO THE INCOME STATEMENT
1 Revenue
The composition of the revenue of the Group, by brand, is as follows:
EUR million 2008 2007
Audi brand 25,534 25,249
Lamborghini brand 404 404
Volkswagen brand 2,705 2,802
SEAT brand 290 369
Škoda brand 223 221
Bentley brand 12 15
Vehicle sales 29,168 29,060
Other sales 5,028 4,557
Revenue 34,196 33,617
Vehicle revenue includes proceeds from the Audi Group from the sale of vehicles of the Audi and
Lamborghini brands as well as of other brands of the Volkswagen Group.
Revenue from other sales primarily includes proceeds from the sale of engines and genuine
parts, and proceeds of AUDI BRUSSELS S.A./N.V. (Brussels, Belgium), which was consolidated
for the first time in the 2008 fiscal year, from the contract manufacture of VW Polo vehicles for
Volkswagen AG.
Revenue is categorized by region for the purpose of segment reporting, analogously to the sys-
tem used for internal Group steering and reporting.
2 Cost of sales
Amounting to EUR 28,848 (28,478) million, cost of sales comprises the costs incurred in gener-
ating revenue and purchase prices in trading transactions. This item also includes expenses
resulting from the formation of provisions for warranty costs, for development costs that can-
not be capitalized, for scheduled and unscheduled amortization of capitalized development
costs, and for property, plant and equipment for manufacturing purposes.
The impairment losses were recorded on the basis of updated impairment tests and took par-
ticular account of market risks and exchange rate risks.
3 Distribution costs
The distribution costs of EUR 3,240 (2,737) million substantially comprise labor and materials
costs for marketing and sales promotion, advertising, public relations activities and outward
freight, as well as depreciation attributable to the sales organization.
4 Administrative expenses
Administrative expenses of EUR 302 (266) million include labor and materials costs, as well as
depreciation attributable to administrative operations.