Audi 2008 Annual Report Download - page 242
Download and view the complete annual report
Please find page 242 of the 2008 Audi annual report below. You can navigate through the pages in the report by either clicking on the pages listed below, or by using the keyword search tool below to find specific information within the annual report.-
 1
1 -
2
-
3
-
4
-
5
-
6
-
7
-
8
-
9
-
10
-
11
-
12
-
13
-
14
-
15
-
16
-
17
-
18
-
19
-
20
-
21
-
22
-
23
-
24
-
25
-
26
-
27
-
28
-
29
-
30
-
31
-
32
-
33
-
34
-
35
-
36
-
37
-
38
-
39
-
40
-
41
-
42
-
43
-
44
-
45
-
46
-
47
-
48
-
49
-
50
-
51
-
52
-
53
-
54
-
55
-
56
-
57
-
58
-
59
-
60
-
61
-
62
-
63
-
64
-
65
-
66
-
67
-
68
-
69
-
70
-
71
-
72
-
73
-
74
-
75
-
76
-
77
-
78
-
79
-
80
-
81
-
82
-
83
-
84
-
85
-
86
-
87
-
88
-
89
-
90
-
91
-
92
-
93
-
94
-
95
-
96
-
97
-
98
-
99
-
100
-
101
-
102
-
103
-
104
-
105
-
106
-
107
-
108
-
109
-
110
-
111
-
112
-
113
-
114
-
115
-
116
-
117
-
118
-
119
-
120
-
121
-
122
-
123
-
124
-
125
-
126
-
127
-
128
-
129
-
130
-
131
-
132
-
133
-
134
-
135
-
136
-
137
-
138
-
139
-
140
-
141
-
142
-
143
-
144
-
145
-
146
-
147
-
148
-
149
-
150
-
151
-
152
-
153
-
154
-
155
-
156
-
157
-
158
-
159
-
160
-
161
-
162
-
163
-
164
-
165
-
166
-
167
-
168
-
169
-
170
-
171
-
172
-
173
-
174
-
175
-
176
-
177
-
178
-
179
-
180
-
181
-
182
-
183
-
184
-
185
-
186
-
187
-
188
-
189
-
190
-
191
-
192
-
193
-
194
-
195
-
196
-
197
-
198
-
199
-
200
-
201
-
202
-
203
-
204
-
205
-
206
-
207
-
208
-
209
-
210
-
211
-
212
-
213
-
214
-
215
-
216
-
217
-
218
-
219
-
220
-
221
-
222
-
223
-
224
-
225
-
226
-
227
-
228
-
229
-
230
-
231
-
 232
232 -
 233
233 -
 234
234 -
 235
235 -
 236
236 -
 237
237 -
 238
238 -
 239
239 -
 240
240 -
 241
241 -
 242
242 -
 243
243 -
 244
244 -
 245
245 -
 246
246 -
 247
247 -
 248
248 -
 249
249 -
 250
250 -
 251
251 -
 252
252 -
253
-
254
-
255
-
256
-
257
-
258
-
259
-
260
-
261
 |
 |

223
Consolidated Financial
Statements
170 Income Statement
171 Balance Sheet
172 Cash Flow Statement
173 Statement of Changes in Equity
Notes to the Consolidated
Financial Statements
174 Development of
fixed assets 2008
176 Development of
fixed assets 2007
178 General information
183 Recognition and
measurement principles
189 Notes to the Income
Statement
196 Notes to the Balance Sheet
209 Additional disclosures
227 Events occurring subsequent
to the balance sheet date
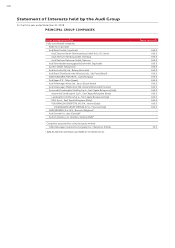
228 Statement of Interests
held by the Audi Group
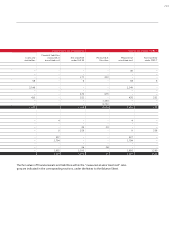
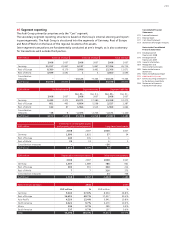
46 Segment reporting
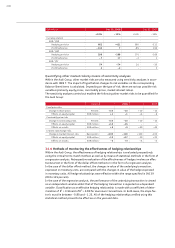
The Audi Group primarily comprises only the “Cars” segment.
The secondary segment reporting structure is based on the Group’s internal steering and report-
ing arrangements. The Audi Group is structured into the segments of Germany, Rest of Europe
and Rest of World on the basis of the regional locations of its assets.
Inter-segment transactions are fundamentally conducted at arm’s length, as is also customary
for transactions with outside third parties.
EUR million External revenue Internal revenue Total revenue
2008 2007 2008 2007 2008 2007
Germany 21,217 20,847 6,137 5,867 27,354 26,714
Rest of Europe 8,380 8,179 3,986 3,492 12,366 11,671
Rest of World 4,599 4,591 144,600 4,595
Consolidation
measures –– – 10,124 – 9,363 – 10,124 – 9,363
Audi Group 34,196 33,617 ––34,196 33,617
EUR million Profit before tax Segment assets Segment liabilities
2008 2007
Dec. 31,
2008
Dec. 31,
2007
Dec. 31,
2008
Dec. 31,
2007
Germany 2,432 2,371 19,071 17,580 13,318 12,272
Rest of Europe 661 465 6,804 5,568 2,527 1,387
Rest of World 132 87 1,964 1,515 1,963 1,664
Consolidation
measures – 48 – 8 – 2,473 – 2,745 – 2,171 – 1,140
Audi Group 3,177 2,915 25,366 21,918 15,637 14,183
EUR million
Investments in intangible assets
and property, plant and equipment Long-term investments
2008 2007 2008 2007
Germany 1,990 1,831 57 34
Rest of Europe 440 235 1–
Rest of World 23 13 12
Consolidation measures – –– 26 –
Audi Group 2,453 2,079 33 36
EUR million Depreciation and amortization Other non-cash expenses
2008 2007 2008 2007
Germany 1,507 1,689 786 961
Rest of Europe 394 591 328 214
Rest of World 7 7316 273
Consolidation measures – –24 738
Audi Group 1,908 2,287 1,454 2,186
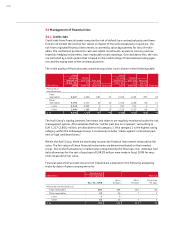
Sales revenues by region 2008 2007
EUR million %EUR million %
Germany 9,503 27.8% 8,994 26.8%
Rest of Europe 16,651 48.7% 17,017 50.6%
Asia-Pacific 4,250 12.4% 3,641 10.8%
North America 3,321 9.7% 3,479 10.3%
Africa 234 0.7% 289 0.9%
South America 237 0.7% 197 0.6%
Total 34,196 100.0% 33,617 100.0%