Audi 2008 Annual Report Download - page 236
Download and view the complete annual report
Please find page 236 of the 2008 Audi annual report below. You can navigate through the pages in the report by either clicking on the pages listed below, or by using the keyword search tool below to find specific information within the annual report.-
 1
1 -
2
-
3
-
4
-
5
-
6
-
7
-
8
-
9
-
10
-
11
-
12
-
13
-
14
-
15
-
16
-
17
-
18
-
19
-
20
-
21
-
22
-
23
-
24
-
25
-
26
-
27
-
28
-
29
-
30
-
31
-
32
-
33
-
34
-
35
-
36
-
37
-
38
-
39
-
40
-
41
-
42
-
43
-
44
-
45
-
46
-
47
-
48
-
49
-
50
-
51
-
52
-
53
-
54
-
55
-
56
-
57
-
58
-
59
-
60
-
61
-
62
-
63
-
64
-
65
-
66
-
67
-
68
-
69
-
70
-
71
-
72
-
73
-
74
-
75
-
76
-
77
-
78
-
79
-
80
-
81
-
82
-
83
-
84
-
85
-
86
-
87
-
88
-
89
-
90
-
91
-
92
-
93
-
94
-
95
-
96
-
97
-
98
-
99
-
100
-
101
-
102
-
103
-
104
-
105
-
106
-
107
-
108
-
109
-
110
-
111
-
112
-
113
-
114
-
115
-
116
-
117
-
118
-
119
-
120
-
121
-
122
-
123
-
124
-
125
-
126
-
127
-
128
-
129
-
130
-
131
-
132
-
133
-
134
-
135
-
136
-
137
-
138
-
139
-
140
-
141
-
142
-
143
-
144
-
145
-
146
-
147
-
148
-
149
-
150
-
151
-
152
-
153
-
154
-
155
-
156
-
157
-
158
-
159
-
160
-
161
-
162
-
163
-
164
-
165
-
166
-
167
-
168
-
169
-
170
-
171
-
172
-
173
-
174
-
175
-
176
-
177
-
178
-
179
-
180
-
181
-
182
-
183
-
184
-
185
-
186
-
187
-
188
-
189
-
190
-
191
-
192
-
193
-
194
-
195
-
196
-
197
-
198
-
199
-
200
-
201
-
202
-
203
-
204
-
205
-
206
-
207
-
208
-
209
-
210
-
211
-
212
-
213
-
214
-
215
-
216
-
217
-
218
-
219
-
220
-
221
-
222
-
223
-
224
-
225
-
 226
226 -
 227
227 -
 228
228 -
 229
229 -
 230
230 -
 231
231 -
 232
232 -
 233
233 -
 234
234 -
 235
235 -
 236
236 -
 237
237 -
 238
238 -
 239
239 -
 240
240 -
 241
241 -
 242
242 -
 243
243 -
 244
244 -
 245
245 -
 246
246 -
247
-
248
-
249
-
250
-
251
-
252
-
253
-
254
-
255
-
256
-
257
-
258
-
259
-
260
-
261
 |
 |

217
Consolidated Financial
Statements
170 Income Statement
171 Balance Sheet
172 Cash Flow Statement
173 Statement of Changes in Equity
Notes to the Consolidated
Financial Statements
174 Development of
fixed assets 2008
176 Development of
fixed assets 2007
178 General information
183 Recognition and
measurement principles
189 Notes to the Income
Statement
196 Notes to the Balance Sheet
209 Additional disclosures
227 Events occurring subsequent
to the balance sheet date
228 Statement of Interests
held by the Audi Group
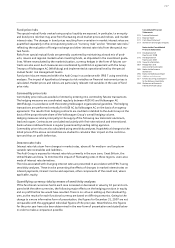
Fund price risks
The special mutual funds created using surplus liquidity are exposed, in particular, to an equity
and bond price risk that may arise from fluctuating stock market prices and indices, and market
interest rates. The changes in bond prices resulting from a variation in market interest rates are
quantified separately in the corresponding notes on “Currency risks” and on “Interest rate risks,”
reflecting the evaluation of foreign exchange and other interest rate risks from the special mu-
tual funds.
Risks from special mutual funds are generally countered by maintaining a broad mix of prod-
ucts, issuers and regional markets when investing funds, as stipulated in the investment guide-
lines. Where necessitated by the market situation, currency hedges in the form of futures con-
tracts are also used. Such measures are coordinated by AUDI AG in agreement with the Group
Treasury of Volkswagen AG (Wolfsburg) and implemented at operational level by the special
mutual funds’ risk management teams.
Fund price risks are measured within the Audi Group in accordance with IFRS 7 using sensitivity
analyses. The impact of hypothetical changes to risk variables on financial instrument prices is
calculated. Market prices and indices are particularly relevant risk variables in the case of fund
price risks.
Commodity price risks
Commodity price risks are avoided or limited by entering into commodity futures transactions.
The hedging measures are coordinated regularly between AUDI AG and Volkswagen AG
(Wolfsburg), in accordance with the existing Volkswagen organizational guideline. The hedging
transactions are performed centrally for AUDI AG by Volkswagen AG on the basis of an agency
agreement. The results from hedging contracts are credited or debited to the Audi Group on the
basis of the proportionate share of the Volkswagen Group’s overall hedging volume.
Hedging measures relate principally to the supply of the following raw materials: aluminum,
lead and copper. Contracts are concluded exclusively with first-rate national and international
banks whose creditworthiness is regularly examined by leading rating agencies.
Commodity price risks are also calculated using sensitivity analyses. Hypothetical changes to the
listed prices of the above commodities are studied to calculate their impact on the cost struc-
ture and thus on profit before tax.
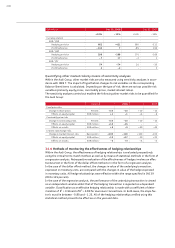
Interest rate risks
Interest rate risks stem from changes in market rates, above all for medium- and long-term
variable-rate receivables and liabilities.
The Audi Group is exposed to interest rate risks primarily in the euro zone, Great Britain, the
United States and Asia. To minimize the impact of fluctuating rates in these regions, use is also
made of interest rate derivatives.
The risks associated with changing interest rates are presented in accordance with IFRS 7 using
sensitivity analyses. These involve presenting the effects of changes in market interest rates on
interest payments, interest income and expenses, other components of the result and, where
applicable, equity.
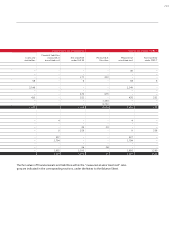
Quantifying currency risks by means of sensitivity analyses
If the functional currencies had in each case increased or decreased in value by 10 percent com-
pared with the other currencies, the following major effects on the hedging provision in equity
and on profit before tax would have resulted. There is no virtue in adding up the individual fig-
ures, as the results for each functional currency are based on differing scenarios. Owing to the
change to a more informative form of presentation, the figures for December 31, 2007 are not
comparable with the aggregated individual figures of the prior year. Nevertheless, the figures
for the prior year have also been determined in the new form of presentation and stated below
in order to make a comparison possible.