Audi 2008 Annual Report Download - page 233
Download and view the complete annual report
Please find page 233 of the 2008 Audi annual report below. You can navigate through the pages in the report by either clicking on the pages listed below, or by using the keyword search tool below to find specific information within the annual report.-
 1
1 -
2
-
3
-
4
-
5
-
6
-
7
-
8
-
9
-
10
-
11
-
12
-
13
-
14
-
15
-
16
-
17
-
18
-
19
-
20
-
21
-
22
-
23
-
24
-
25
-
26
-
27
-
28
-
29
-
30
-
31
-
32
-
33
-
34
-
35
-
36
-
37
-
38
-
39
-
40
-
41
-
42
-
43
-
44
-
45
-
46
-
47
-
48
-
49
-
50
-
51
-
52
-
53
-
54
-
55
-
56
-
57
-
58
-
59
-
60
-
61
-
62
-
63
-
64
-
65
-
66
-
67
-
68
-
69
-
70
-
71
-
72
-
73
-
74
-
75
-
76
-
77
-
78
-
79
-
80
-
81
-
82
-
83
-
84
-
85
-
86
-
87
-
88
-
89
-
90
-
91
-
92
-
93
-
94
-
95
-
96
-
97
-
98
-
99
-
100
-
101
-
102
-
103
-
104
-
105
-
106
-
107
-
108
-
109
-
110
-
111
-
112
-
113
-
114
-
115
-
116
-
117
-
118
-
119
-
120
-
121
-
122
-
123
-
124
-
125
-
126
-
127
-
128
-
129
-
130
-
131
-
132
-
133
-
134
-
135
-
136
-
137
-
138
-
139
-
140
-
141
-
142
-
143
-
144
-
145
-
146
-
147
-
148
-
149
-
150
-
151
-
152
-
153
-
154
-
155
-
156
-
157
-
158
-
159
-
160
-
161
-
162
-
163
-
164
-
165
-
166
-
167
-
168
-
169
-
170
-
171
-
172
-
173
-
174
-
175
-
176
-
177
-
178
-
179
-
180
-
181
-
182
-
183
-
184
-
185
-
186
-
187
-
188
-
189
-
190
-
191
-
192
-
193
-
194
-
195
-
196
-
197
-
198
-
199
-
200
-
201
-
202
-
203
-
204
-
205
-
206
-
207
-
208
-
209
-
210
-
211
-
212
-
213
-
214
-
215
-
216
-
217
-
218
-
219
-
220
-
221
-
222
-
 223
223 -
 224
224 -
 225
225 -
 226
226 -
 227
227 -
 228
228 -
 229
229 -
 230
230 -
 231
231 -
 232
232 -
 233
233 -
 234
234 -
 235
235 -
 236
236 -
 237
237 -
 238
238 -
 239
239 -
 240
240 -
 241
241 -
 242
242 -
 243
243 -
244
-
245
-
246
-
247
-
248
-
249
-
250
-
251
-
252
-
253
-
254
-
255
-
256
-
257
-
258
-
259
-
260
-
261
 |
 |

214
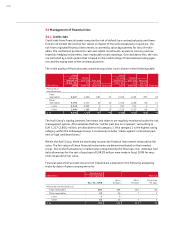
34 Management of financial risks
34.1 Credit risks
Credit risks from financial assets comprise the risk of default by a contractual party and there-
fore do not exceed the positive fair values in respect of the contractual party in question. The
risk from originated financial instruments is covered by value adjustments for loss of receiv-
ables. The contractual partners for cash and capital investments, as well as currency and raw
materials hedging instruments, have impeccable credit standings. Over and above this, the risks
are restricted by a limit system that is based on the credit ratings of international rating agen-
cies and the equity base of the contractual parties.
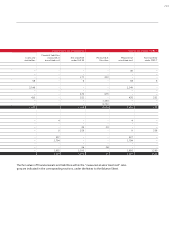
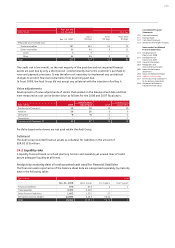
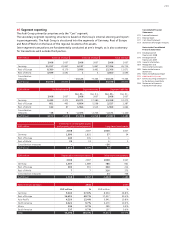
The credit quality of financial assets valued at acquisition cost is shown in the following table:
EUR million
Gross
carrying
amount as
of Dec. 31,
2008
Neither
past due
nor
impaired
Past due
and not
impaired Impaired
Gross
carrying
amount as
of Dec. 31,
2007
Neither
past due
nor
impaired
Past due
and not
impaired Impaired
Measured at
amortized cost
Trade
receivables 2,247 1,490 687 70 2,163 1,353 787 23
Other
receivables 5,793 5,727 50 16 1,525 1,448 66 11
Loans 4,344 4,343 0 1 312 311 0 1
Other 1,449 1,384 50 15 1,213 1,137 66 10
Total 8,040 7,217 737 86 3,688 2,801 853 34
The Audi Group’s trading partners, borrowers and debtors are regularly monitored under the risk
management system. All receivables that are “neither past due nor impaired,” amounting to
EUR 7,217 (2,801) million, are allocable to risk category 1. Risk category 1 is the highest rating
category within the Volkswagen Group; it exclusively includes “claims against contractual part-
ners of high creditworthiness.”
Within the Audi Group, there are absolutely no past due financial instruments measured at fair
value. The fair values of these financial instruments are determined based on their market
prices. Due to the fluctuations in market value precipitated by the financial crisis, individual bad
debt allowances for the cost of purchase of EUR 83 million were made in fiscal 2008 for secu-
rities measured at fair value.
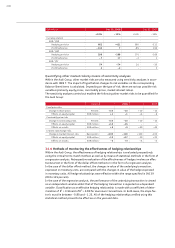
Financial assets that are past due and not impaired are presented in the following analysis by
maturity dates of gross carrying amounts:
EUR million
Past due and
not impaired Past due
Dec. 31, 2008
Up to
30 days
30 to
90 days
More than
90 days
Measured at amortized cost
Trade receivables 687 493 134 60
Other receivables 50 40 7 3
Loans 00– –
Other 50 40 7 3
Total 737 533 141 63