Audi 2008 Annual Report Download - page 234
Download and view the complete annual report
Please find page 234 of the 2008 Audi annual report below. You can navigate through the pages in the report by either clicking on the pages listed below, or by using the keyword search tool below to find specific information within the annual report.-
 1
1 -
2
-
3
-
4
-
5
-
6
-
7
-
8
-
9
-
10
-
11
-
12
-
13
-
14
-
15
-
16
-
17
-
18
-
19
-
20
-
21
-
22
-
23
-
24
-
25
-
26
-
27
-
28
-
29
-
30
-
31
-
32
-
33
-
34
-
35
-
36
-
37
-
38
-
39
-
40
-
41
-
42
-
43
-
44
-
45
-
46
-
47
-
48
-
49
-
50
-
51
-
52
-
53
-
54
-
55
-
56
-
57
-
58
-
59
-
60
-
61
-
62
-
63
-
64
-
65
-
66
-
67
-
68
-
69
-
70
-
71
-
72
-
73
-
74
-
75
-
76
-
77
-
78
-
79
-
80
-
81
-
82
-
83
-
84
-
85
-
86
-
87
-
88
-
89
-
90
-
91
-
92
-
93
-
94
-
95
-
96
-
97
-
98
-
99
-
100
-
101
-
102
-
103
-
104
-
105
-
106
-
107
-
108
-
109
-
110
-
111
-
112
-
113
-
114
-
115
-
116
-
117
-
118
-
119
-
120
-
121
-
122
-
123
-
124
-
125
-
126
-
127
-
128
-
129
-
130
-
131
-
132
-
133
-
134
-
135
-
136
-
137
-
138
-
139
-
140
-
141
-
142
-
143
-
144
-
145
-
146
-
147
-
148
-
149
-
150
-
151
-
152
-
153
-
154
-
155
-
156
-
157
-
158
-
159
-
160
-
161
-
162
-
163
-
164
-
165
-
166
-
167
-
168
-
169
-
170
-
171
-
172
-
173
-
174
-
175
-
176
-
177
-
178
-
179
-
180
-
181
-
182
-
183
-
184
-
185
-
186
-
187
-
188
-
189
-
190
-
191
-
192
-
193
-
194
-
195
-
196
-
197
-
198
-
199
-
200
-
201
-
202
-
203
-
204
-
205
-
206
-
207
-
208
-
209
-
210
-
211
-
212
-
213
-
214
-
215
-
216
-
217
-
218
-
219
-
220
-
221
-
222
-
223
-
 224
224 -
 225
225 -
 226
226 -
 227
227 -
 228
228 -
 229
229 -
 230
230 -
 231
231 -
 232
232 -
 233
233 -
 234
234 -
 235
235 -
 236
236 -
 237
237 -
 238
238 -
 239
239 -
 240
240 -
 241
241 -
 242
242 -
 243
243 -
 244
244 -
245
-
246
-
247
-
248
-
249
-
250
-
251
-
252
-
253
-
254
-
255
-
256
-
257
-
258
-
259
-
260
-
261
 |
 |

215
Consolidated Financial
Statements
170 Income Statement
171 Balance Sheet
172 Cash Flow Statement
173 Statement of Changes in Equity
Notes to the Consolidated
Financial Statements
174 Development of
fixed assets 2008
176 Development of
fixed assets 2007
178 General information
183 Recognition and
measurement principles
189 Notes to the Income
Statement
196 Notes to the Balance Sheet
209 Additional disclosures
227 Events occurring subsequent
to the balance sheet date
228 Statement of Interests
held by the Audi Group
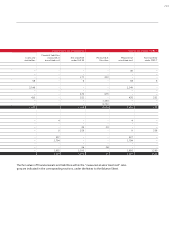
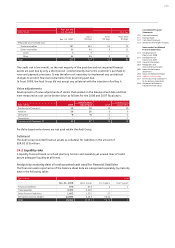
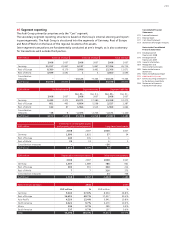
EUR million
Past due and
not impaired Past due
Dec. 31, 2007
Up to
30 days
30 to
90 days
More than
90 days
Measured at amortized cost
Trade receivables 787 661 51 75
Other receivables 66 46 911
Loans 0 0 – –
Other 66 46 911
Total 853 707 60 86
The credit risk is low overall, as the vast majority of the past due and not impaired financial
assets are past due by only a short period – predominantly due to the customer’s purchase in-
voice and payment processes. It was therefore not necessary to implement any contractual
changes to prevent financial instruments from becoming past due.
In fiscal 2008, the Audi Group did not accept any collateral with the intention of selling it.
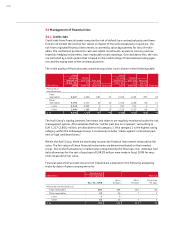
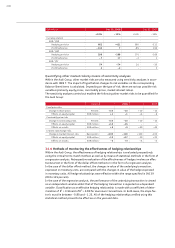
Value adjustments
Developments of value adjustments of claims that existed on the balance sheet date and that
were measured at cost can be broken down as follows for the 2008 and 2007 fiscal years:
EUR million 2008
Specific value
adjustment 2007
Specific value
adjustment
Position as of January 1 19 19 19 19
Addition 26 26 99
Utilization – 8 – 8– 2 – 2
Dissolution – – – 7 – 7
Position as of December 31 37 37 19 19
Portfolio-based write-downs are not used within the Audi Group.
Collateral
The Audi Group recorded financial assets as collateral for liabilities in the amount of
EUR 82 (53) million.
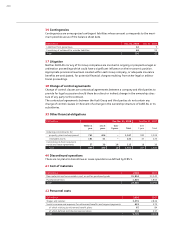
34.2 Liquidity risks
A liquidity forecast based on a fixed planning horizon and available yet unused lines of credit
assure adequate liquidity at all times.
Analysis by maturity date of undiscounted cash used for financial liabilities
The financial assets reported as of the balance sheet date are categorized separately by maturity
date in the following table:
EUR million Total
Dec. 31, 2008 Up to 1 year 1 to 5 years Over 5 years
Financial liabilities 676 673 21
Trade payables 3,302 3,302 ––
Other financial liabilities 1,602 1,575 27 –
Derivatives used as hedges 12,685 5,243 7,442 –
Total 18,265 10,793 7,471 1