Audi 2008 Annual Report Download - page 237
Download and view the complete annual report
Please find page 237 of the 2008 Audi annual report below. You can navigate through the pages in the report by either clicking on the pages listed below, or by using the keyword search tool below to find specific information within the annual report.-
 1
1 -
2
-
3
-
4
-
5
-
6
-
7
-
8
-
9
-
10
-
11
-
12
-
13
-
14
-
15
-
16
-
17
-
18
-
19
-
20
-
21
-
22
-
23
-
24
-
25
-
26
-
27
-
28
-
29
-
30
-
31
-
32
-
33
-
34
-
35
-
36
-
37
-
38
-
39
-
40
-
41
-
42
-
43
-
44
-
45
-
46
-
47
-
48
-
49
-
50
-
51
-
52
-
53
-
54
-
55
-
56
-
57
-
58
-
59
-
60
-
61
-
62
-
63
-
64
-
65
-
66
-
67
-
68
-
69
-
70
-
71
-
72
-
73
-
74
-
75
-
76
-
77
-
78
-
79
-
80
-
81
-
82
-
83
-
84
-
85
-
86
-
87
-
88
-
89
-
90
-
91
-
92
-
93
-
94
-
95
-
96
-
97
-
98
-
99
-
100
-
101
-
102
-
103
-
104
-
105
-
106
-
107
-
108
-
109
-
110
-
111
-
112
-
113
-
114
-
115
-
116
-
117
-
118
-
119
-
120
-
121
-
122
-
123
-
124
-
125
-
126
-
127
-
128
-
129
-
130
-
131
-
132
-
133
-
134
-
135
-
136
-
137
-
138
-
139
-
140
-
141
-
142
-
143
-
144
-
145
-
146
-
147
-
148
-
149
-
150
-
151
-
152
-
153
-
154
-
155
-
156
-
157
-
158
-
159
-
160
-
161
-
162
-
163
-
164
-
165
-
166
-
167
-
168
-
169
-
170
-
171
-
172
-
173
-
174
-
175
-
176
-
177
-
178
-
179
-
180
-
181
-
182
-
183
-
184
-
185
-
186
-
187
-
188
-
189
-
190
-
191
-
192
-
193
-
194
-
195
-
196
-
197
-
198
-
199
-
200
-
201
-
202
-
203
-
204
-
205
-
206
-
207
-
208
-
209
-
210
-
211
-
212
-
213
-
214
-
215
-
216
-
217
-
218
-
219
-
220
-
221
-
222
-
223
-
224
-
225
-
226
-
 227
227 -
 228
228 -
 229
229 -
 230
230 -
 231
231 -
 232
232 -
 233
233 -
 234
234 -
 235
235 -
 236
236 -
 237
237 -
 238
238 -
 239
239 -
 240
240 -
 241
241 -
 242
242 -
 243
243 -
 244
244 -
 245
245 -
 246
246 -
 247
247 -
248
-
249
-
250
-
251
-
252
-
253
-
254
-
255
-
256
-
257
-
258
-
259
-
260
-
261
 |
 |

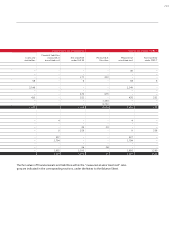
218
EUR million Dec. 31, 2008 Dec. 31, 2007
+ 10% – 10% + 10% – 10%
Currency relation
EUR / USD
Hedging provision 662 – 421 560 – 512
Profit before tax – 134 7 – 85 104
EUR / GBP
Hedging provision 288 – 288 170 – 166
Profit before tax – 7 17 – 2 1
EUR / JPY
Hedging provision 54 – 54 20 – 20
Profit before tax 2 – 2– 2
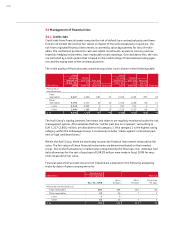
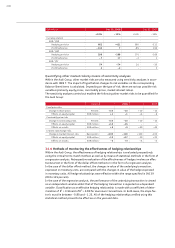
Quantifying other market risks by means of sensitivity analyses
Within the Audi Group, other market risks are also measured using sensitivity analyses in accor-
dance with IFRS 7. The impact of hypothetical changes to risk variables on the corresponding
Balance Sheet items is calculated. Depending on the type of risk, there are various possible risk
variables (primarily equity prices, commodity prices, market interest rates).
The sensitivity analyses carried out enabled the following other market risks to be quantified for
the Audi Group:
Data in 2008 2007
Fund price risks
Change in share prices Percent + 10 – 10 + 10 – 10
Effects on equity capital EUR million + 1 – 1 + 6 – 6
Commodity price risks
Change in commodity prices Percent + 10 – 10 + 10 – 10
Effects on equity capital EUR million + 15 – 15 – –
Effects on results EUR million + 9 – 9 + 40 – 40
Interest rate change risks
Change in market interest rate Basis points + 100 – 100 + 100 – 100
Effects on equity capital EUR million – 15 + 17 – 20 + 22
Effects on results EUR million – 3 + 3 + 4 – 4
34.4 Methods of monitoring the effectiveness of hedging relationships
Within the Audi Group, the effectiveness of hedging relationships is evaluated prospectively
using the critical terms match method, as well as by means of statistical methods in the form of
a regression analysis. Retrospective evaluation of the effectiveness of hedges involves an effec-
tiveness test in the form of the dollar offset method or in the form of a regression analysis.
In the case of the dollar offset method, the changes in value of the underlying transaction,
expressed in monetary units, are compared with the changes in value of the hedge expressed
in monetary units. All hedge relationships were effective within the range specified in IAS 39
(80 to 125 percent).
In the case of the regression analysis, the performance of the underlying transaction is viewed
as an independent variable whilst that of the hedging transaction is regarded as a dependent
variable. Classification as an effective hedging relationship is made with a coefficient of deter-
mination of R2 > 0.96 and of R2 > 0.80 for aluminum transactions. In both cases, the slope fac-
tor b must lie between – 0.80 and – 1.25. All of the hedging relationships verified using this
statistical method proved to be effective on the year-end date.