Advance Auto Parts 2013 Annual Report Download - page 91
Download and view the complete annual report
Please find page 91 of the 2013 Advance Auto Parts annual report below. You can navigate through the pages in the report by either clicking on the pages listed below, or by using the keyword search tool below to find specific information within the annual report.-
 1
1 -
2
-
3
-
4
-
5
-
6
-
7
-
8
-
9
-
10
-
11
-
12
-
13
-
14
-
15
-
16
-
17
-
18
-
19
-
20
-
21
-
22
-
23
-
24
-
25
-
26
-
27
-
28
-
29
-
30
-
31
-
32
-
33
-
34
-
35
-
36
-
37
-
38
-
39
-
40
-
41
-
42
-
43
-
44
-
45
-
46
-
47
-
48
-
49
-
50
-
51
-
52
-
53
-
54
-
55
-
56
-
57
-
58
-
59
-
60
-
61
-
62
-
63
-
64
-
65
-
66
-
67
-
68
-
69
-
70
-
71
-
72
-
73
-
74
-
75
-
76
-
77
-
78
-
79
-
80
-
 81
81 -
 82
82 -
 83
83 -
 84
84 -
 85
85 -
 86
86 -
 87
87 -
 88
88 -
 89
89 -
 90
90 -
 91
91 -
 92
92 -
 93
93 -
 94
94 -
 95
95 -
 96
96 -
 97
97 -
 98
98 -
 99
99 -
 100
100 -
 101
101 -
102
-
103
-
104
-
105
-
106
-
107
-
108
 |
 |

ADVANCE AUTO PARTS, INC. AND SUBSIDIARIES
NOTES TO THE CONSOLIDATED FINANCIAL STATEMENTS
December 28, 2013, December 29, 2012 and December 31, 2011
(in thousands, except per share data)
F-39
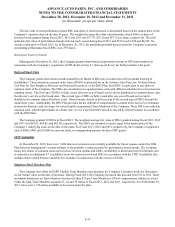
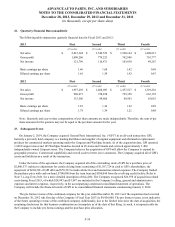
22. Quarterly Financial Data (unaudited):
The following table summarizes quarterly financial data for Fiscal 2013 and 2012:
2013 First Second Third Fourth
(16 weeks) (12 weeks) (12 weeks) (12 weeks)
Net sales $ 2,015,304 $ 1,549,553 $ 1,520,144 $ 1,408,813
Gross profit 1,008,206 779,223 762,940 701,777
Net income 121,790 116,871 103,830 49,267
Basic earnings per share 1.66 1.60 1.42 0.68
Diluted earnings per share 1.65 1.59 1.42 0.67
2012 First Second Third Fourth
(16 weeks) (12 weeks) (12 weeks) (12 weeks)
Net sales $ 1,957,292 $ 1,460,983 $ 1,457,527 $ 1,329,201
Gross profit 980,673 728,858 725,350 663,155
Net income 133,506 99,606 89,503 65,055
Basic earnings per share 1.83 1.36 1.22 0.89
Diluted earnings per share 1.79 1.34 1.21 0.88
Note: Quarterly and year-to-date computations of per share amounts are made independently. Therefore, the sum of per
share amounts for the quarters may not be equal to the per share amount for the year.
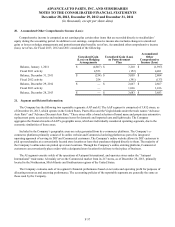
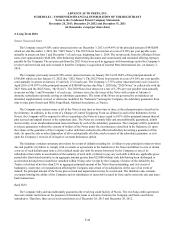
23. Subsequent Event:
On January 2, 2014, the Company acquired General Parts International, Inc. (“GPI”) in an all-cash transaction. GPI,
formerly a privately held company, is a leading distributor and supplier of original equipment and aftermarket replacement
products for commercial markets operating under the Carquest and Worldpac brands. As of the acquisition date, GPI operated
1,248 Carquest stores and 105 Worldpac branches located in 45 states and Canada and serviced approximately 1,400
independently-owned Carquest stores. The Company believes the acquisition of GPI will allow the Company to expand its
geographic presence, Commercial capabilities and overall scale to better serve customers. The Company acquired all of GPI’s
assets and liabilities as a result of the transaction.
Under the terms of the agreement, the Company acquired all of the outstanding stock of GPI for a purchase price of
$2,080,537 (subject to adjustment for certain closing items) consisting of $1,307,724 in cash to GPI’s shareholders, the
repayment of $694,301 of GPI debt and $78,512 in make-whole fees and transaction-related expenses. The Company funded
the purchase price with cash on-hand, $700,000 from the term loan and $306,046 from the revolving credit facility. Refer to
Note 7, Long-Term Debt, for a more detailed description of this debt. The Company recognized $26,970 of acquisition-related
costs during Fiscal 2013, of which $24,983 and $1,987 are included in the Company’s selling, general and administrative
expenses and interest expense, respectively, in the accompanying condensed consolidated statement of operations. The
Company will include the financial results of GPI in its consolidated financial statements commencing January 2, 2014.
The pro forma revenue of the combined company for the year ended December 28, 2013 as if the acquisition had occurred
on December 30, 2012 (the first day of the Company’s Fiscal Year 2013) is $9,456,000. The pro forma revenue is not indicative
of the future operating revenue of the combined company. Additionally, due to the limited time since the date of acquisition, the
remaining disclosures for this business combination are incomplete as of the date of this filing. As such, it is impracticable for
the Company to include pro forma earnings and the purchase price allocation.