Advance Auto Parts 2013 Annual Report Download - page 38
Download and view the complete annual report
Please find page 38 of the 2013 Advance Auto Parts annual report below. You can navigate through the pages in the report by either clicking on the pages listed below, or by using the keyword search tool below to find specific information within the annual report.-
 1
1 -
2
-
3
-
4
-
5
-
6
-
7
-
8
-
9
-
10
-
11
-
12
-
13
-
14
-
15
-
16
-
17
-
18
-
19
-
20
-
21
-
22
-
23
-
24
-
25
-
26
-
27
-
 28
28 -
 29
29 -
 30
30 -
 31
31 -
 32
32 -
 33
33 -
 34
34 -
 35
35 -
 36
36 -
 37
37 -
 38
38 -
 39
39 -
 40
40 -
 41
41 -
 42
42 -
 43
43 -
 44
44 -
 45
45 -
 46
46 -
 47
47 -
 48
48 -
49
-
50
-
51
-
52
-
53
-
54
-
55
-
56
-
57
-
58
-
59
-
60
-
61
-
62
-
63
-
64
-
65
-
66
-
67
-
68
-
69
-
70
-
71
-
72
-
73
-
74
-
75
-
76
-
77
-
78
-
79
-
80
-
81
-
82
-
83
-
84
-
85
-
86
-
87
-
88
-
89
-
90
-
91
-
92
-
93
-
94
-
95
-
96
-
97
-
98
-
99
-
100
-
101
-
102
-
103
-
104
-
105
-
106
-
107
-
108
 |
 |

25
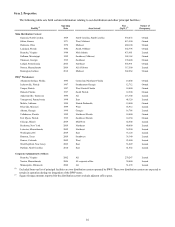
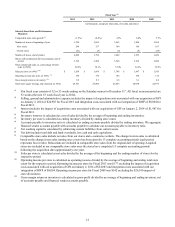
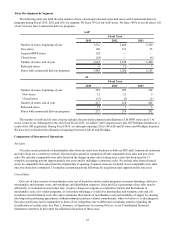
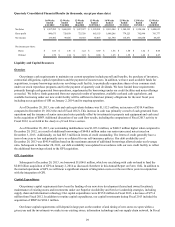
Store Development by Segment
The following table sets forth the total number of new, closed and relocated stores and stores with Commercial delivery
programs during Fiscal 2013, 2012 and 2011 by segment. We lease 79% of our AAP stores. We lease 100% of our AI stores. All
of our AI stores have Commercial delivery programs.
AAP
Fiscal Year
2013 2012 2011
Number of stores, beginning of year 3,576 3,460 3,369
New stores 160 116 95
Acquired BWP stores 124 — —
Closed stores (28) — (4)
Number of stores, end of year 3,832 3,576 3,460
Relocated stores 6 12 7
Stores with commercial delivery programs 3,485 3,266 3,124
AI
Fiscal Year
2013 2012 2011
Number of stores, beginning of year 218 202 194
New stores 12 21 9
Closed stores (13)(5)(1)
Number of stores, end of year 217 218 202
Relocated stores 11 7 3
Stores with commercial delivery programs 217 218 202
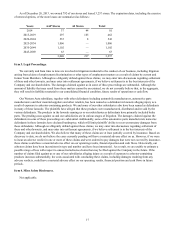
The number of AAP and AI store closures includes the previously planned consolidations of 20 BWP stores and 13 AI
stores, respectively. Subsequent to the end of our Fiscal 2013, we added 1,248 Carquest stores and 105 Worldpac branches as a
result of the GPI acquisition. During Fiscal 2014, we anticipate opening 120 to 140 AAP and AI stores and Worldpac branches.
We have not yet finalized the allocation of openings between AAP, AI and Worldpac.
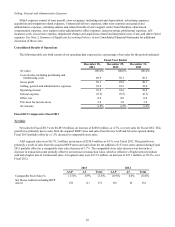
Components of Statement of Operations
Net Sales
Net sales consist primarily of merchandise sales from our retail store locations to both our DIY and Commercial customers
and sales from our e-commerce website. Our total sales growth is comprised of both comparable store sales and new store
sales. We calculate comparable store sales based on the change in store sales starting once a store has been open for 13
complete accounting periods (approximately one year) and by including e-commerce sales. We include sales from relocated
stores in comparable store sales from the original date of opening. Acquired stores are included in our comparable store sales
once the stores have completed 13 complete accounting periods following the acquisition date (approximately one year).
Cost of Sales
Our cost of sales consists of merchandise costs, net of incentives under vendor programs; inventory shrinkage, defective
merchandise and warranty costs; and warehouse and distribution expenses. Gross profit as a percentage of net sales may be
affected by (i) variations in our product mix, (ii) price changes in response to competitive factors and fluctuations in
merchandise costs, (iii) vendor programs, (iv) inventory shrinkage, (v) defective merchandise and warranty costs and (vi)
warehouse and distribution costs. We seek to minimize fluctuations in merchandise costs and instability of supply by entering
into long-term purchasing agreements, without minimum purchase volume commitments, when we believe it is advantageous.
Our gross profit may not be comparable to those of our competitors due to differences in industry practice regarding the
classification of certain costs. See Note 2, Summary of Significant Accounting Policies, to our Consolidated Financial
Statements elsewhere in this report for additional discussion of these costs.