Advance Auto Parts 2013 Annual Report Download - page 86
Download and view the complete annual report
Please find page 86 of the 2013 Advance Auto Parts annual report below. You can navigate through the pages in the report by either clicking on the pages listed below, or by using the keyword search tool below to find specific information within the annual report.-
 1
1 -
2
-
3
-
4
-
5
-
6
-
7
-
8
-
9
-
10
-
11
-
12
-
13
-
14
-
15
-
16
-
17
-
18
-
19
-
20
-
21
-
22
-
23
-
24
-
25
-
26
-
27
-
28
-
29
-
30
-
31
-
32
-
33
-
34
-
35
-
36
-
37
-
38
-
39
-
40
-
41
-
42
-
43
-
44
-
45
-
46
-
47
-
48
-
49
-
50
-
51
-
52
-
53
-
54
-
55
-
56
-
57
-
58
-
59
-
60
-
61
-
62
-
63
-
64
-
65
-
66
-
67
-
68
-
69
-
70
-
71
-
72
-
73
-
74
-
75
-
 76
76 -
 77
77 -
 78
78 -
 79
79 -
 80
80 -
 81
81 -
 82
82 -
 83
83 -
 84
84 -
 85
85 -
 86
86 -
 87
87 -
 88
88 -
 89
89 -
 90
90 -
 91
91 -
 92
92 -
 93
93 -
 94
94 -
 95
95 -
 96
96 -
97
-
98
-
99
-
100
-
101
-
102
-
103
-
104
-
105
-
106
-
107
-
108
 |
 |

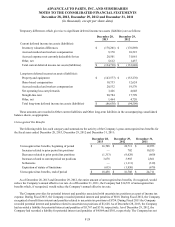
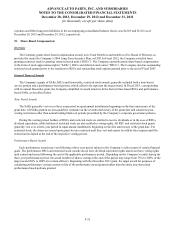
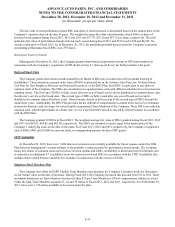
ADVANCE AUTO PARTS, INC. AND SUBSIDIARIES
NOTES TO THE CONSOLIDATED FINANCIAL STATEMENTS
December 28, 2013, December 29, 2012 and December 31, 2011
(in thousands, except per share data)
F-34
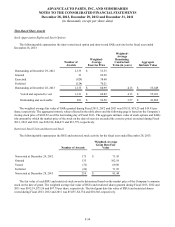
Time-Based Share Awards
Stock Appreciation Rights and Stock Options
The following table summarizes the time-vested stock option and time-vested SARs activity for the fiscal year ended
December 28, 2013:
Number of
Awards
Weighted-
Average
Exercise Price
Weighted-
Average
Remaining
Contractual
Term (in years)
Aggregate
Intrinsic Value
Outstanding at December 29, 2012 2,155 $ 51.55
Granted 33 82.98
Exercised (929) 38.60
Forfeited (124) 70.21
Outstanding at December 28, 2013 1,135 $ 60.99 4.15 $ 55,549
Vested and expected to vest 1,121 $ 60.82 4.13 $ 55,033
Outstanding and exercisable 821 $ 56.50 3.57 $ 43,869
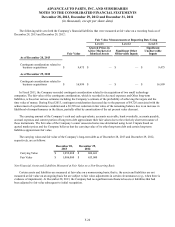
The weighted average fair value of SARs granted during Fiscal 2013, 2012 and 2011 was $18.55, $19.25 and $19.81 per
share, respectively. The aggregate intrinsic value reflected in the table above and the following page is based on the Company’s
closing stock price of $109.92 as of the last trading day of Fiscal 2013. The aggregate intrinsic value of stock options and SARs
(the amount by which the market price of the stock on the date of exercise exceeded the exercise price) exercised during Fiscal
2013, 2012 and 2011 was $38,914, $44,471 and $33,779, respectively.
Restricted Stock Units and Restricted Stock
The following table summarizes the RSU and restricted stock activity for the fiscal year ended December 28, 2013:
Number of Awards
Weighted-Average
Grant Date Fair
Value
Nonvested at December 29, 2012 175 $ 71.43
Granted 133 102.19
Vested (72) 69.89
Forfeited (26) 71.95
Nonvested at December 28, 2013 210 $ 91.44
The fair value of each RSU and restricted stock award is determined based on the market price of the Company’s common
stock on the date of grant. The weighted average fair value of RSUs and restricted shares granted during Fiscal 2013, 2012 and
2011 was $102.19, $75.26 and $67.79 per share, respectively. The total grant date fair value of RSUs and restricted shares
vested during Fiscal 2013, 2012 and 2011 was $5,035, $4,734 and $10,548, respectively.